
- Title
-
Integration of vascular Systems between the brain and spinal cord in zebrafish
- Authors
- Kimura, E., Isogai, S., Hitomi, J.
- Source
- Full text @ Dev. Biol.
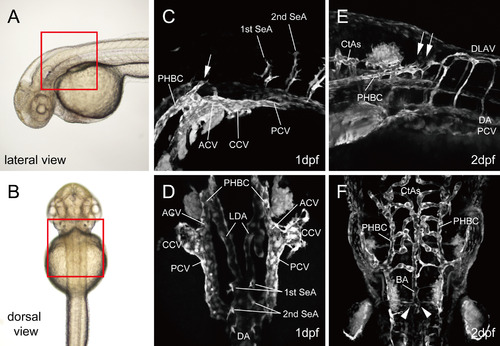
Vascular anatomy of the brain and spinal cord before and after primary integration. Bright field (A and B) and fluorescent (CF) images of Tg(fli1a:EGFP)y1 embryos at 1 dpf (A–D) and 2 dpf (E and F). Lateral (A, C, E) and dorsal (B, D, F) views. Vascular connection between the brain and spinal cord occurred at 1–2 dpf (square region surrounded by red line; A and B). The arrow in C indicates the extending PHBC. Arrows in E indicates the integrative portion. Arrowheads in F indicate the reverse ‘T’ end of the BA. |
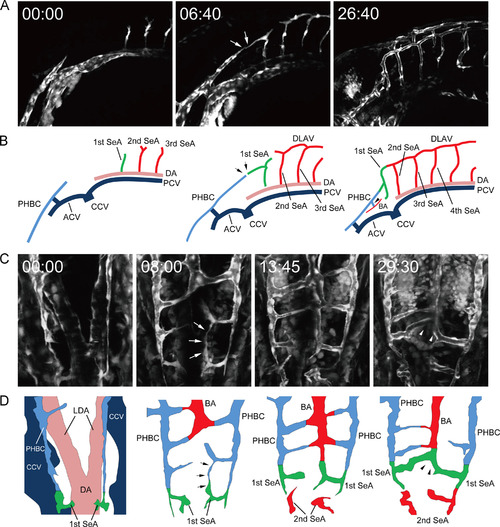
Primary integration between the cerebral and spinal vascular systems. Selected time-lapse images of Tg(fli1a:EGFP)y1 embryos from 1.25 dpf (A and C), and their schematic diagrams (B and D). Lateral (A and B) and dorsal views (C and D). Time (hours:minutes) from the first frame is labeled in each image (A and C). Arrows in A and B indicate the connecting portion of PHBC and the 1st SeA. Arrowheads in A and B indicate BA formation (lateral view). Arrows in C and D indicate the longitudinal loop forming the BA. Arrowheads in C and D indicate the reverse ‘T’ end of the BA. |

First intersegmental arteries connecting the two vascular systems. Selected time-lapse images of Tg(fli1a:nEGFP)y7 embryos from 1.5 dpf (A, C, E, G, I, and K), and their schematic diagrams (B, D, F, H, J, and L; all dorso-lateral view). Time (hours:minutes) from the first frame is labeled in each image. Only the right 1st SeA was observed in the z-stacks in the simple view. The nuclei of endothelial cells consisting of the right 1st SeA were colored in green, those of PHBC in blue, and those of BA and 2nd SeA in red. Arrows in G and H indicate filopodia from the right 1st SeA. Arrowheads in I and J indicate the regressing root of the 1st SeA. |

Influence of flow dynamics for the initial connection. Multi-photon microscopic image of Tg(fli1a:EGFP)y1 embryos at 2 dpf. Embryos were injected with the control MO (A and B) or sih MO (C and D). Lateral (A and C) and dorsal (B and D) views. Arrowhead in B and D indicates the reverse ‘T’ end of the BA. |
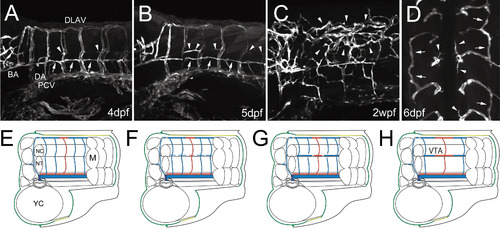
Formation of VTAs. Multi-photon microscopic image of Tg(flk1:EGFP)k7 embryos at 4 (A); 5 (B); and 6 dpf (D), and 2 wpf (C). Lateral (A–C) and dorsal (D) views. (E–H) Schematic diagrams of stepwise VTA formation. SeA and SeV indicate by red- and blue-colored lines respectively. Arrowheads indicate the parachordal vessels. Arrows indicate VTAs. NC: notochord. NT: neural tube. M: myotome. YC: yolk sac. |
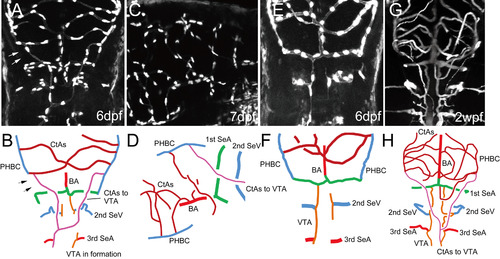
Remodeling process for the temporal integration of cerebral and spinal vascular systems. Multi-photon microscopic image of Tg(fli1a:EGFP)y7 embryos at 6 (A and E) and 7 dpf (C); microangiography with highlighter ink of casper larvae at 2.5 wpf (G); and their schematic diagrams (B, D, F and H). Dorsal (A, E, and G) and dorso-lateral (C) views. Two pathways, connecting vascular systems, are indicated by colored lines (B, D and H pink lines: supplemental route of CtAs to VTAs; B, F and H brown lines: conventional route of BA-1st SeAs to VTAs). Arrows in A and B indicate the disconnection of the PHBC and DLAV. |
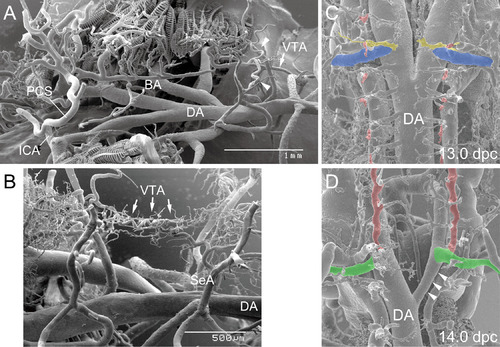
Vascular casts of adult zebrafish and rat embryos. Scanning electron microscopic images of vascular casts of adult zebrafish (dorso-lateral view; A and B) and rat embryos at 13.0 (C) and 14.0 dpc (D; both dorsal view). (C and D) VTA in formation is colored in red; axial vessel for upper limb in blue; seventh SeA in yellow; and subclavian artery in green. Arrows in A and B indicate the VTA. Arrowheads in A indicate the transverse vessel from Se to VTA. Arrowheads in D indicate the regressing aortic arch. |
Reprinted from Developmental Biology, 406(1), Kimura, E., Isogai, S., Hitomi, J., Integration of vascular Systems between the brain and spinal cord in zebrafish, 40-51, Copyright (2015) with permission from Elsevier. Full text @ Dev. Biol.