
FIGURE
Fig. 2
- ID
- ZDB-FIG-151113-12
- Publication
- Kimura et al., 2015 - Integration of vascular Systems between the brain and spinal cord in zebrafish
- Other Figures
- All Figure Page
- Back to All Figure Page
Fig. 2
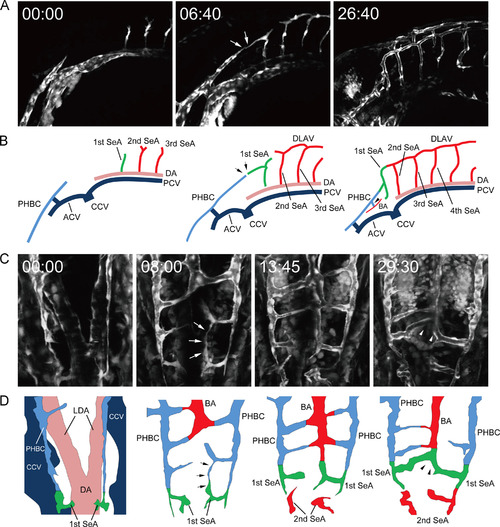
Primary integration between the cerebral and spinal vascular systems. Selected time-lapse images of Tg(fli1a:EGFP)y1 embryos from 1.25 dpf (A and C), and their schematic diagrams (B and D). Lateral (A and B) and dorsal views (C and D). Time (hours:minutes) from the first frame is labeled in each image (A and C). Arrows in A and B indicate the connecting portion of PHBC and the 1st SeA. Arrowheads in A and B indicate BA formation (lateral view). Arrows in C and D indicate the longitudinal loop forming the BA. Arrowheads in C and D indicate the reverse ‘T’ end of the BA. |
Expression Data
Expression Detail
Antibody Labeling
Phenotype Data
Phenotype Detail
Acknowledgments
This image is the copyrighted work of the attributed author or publisher, and
ZFIN has permission only to display this image to its users.
Additional permissions should be obtained from the applicable author or publisher of the image.
Reprinted from Developmental Biology, 406(1), Kimura, E., Isogai, S., Hitomi, J., Integration of vascular Systems between the brain and spinal cord in zebrafish, 40-51, Copyright (2015) with permission from Elsevier. Full text @ Dev. Biol.