
FIGURE
Fig. 1
- ID
- ZDB-FIG-151113-11
- Publication
- Kimura et al., 2015 - Integration of vascular Systems between the brain and spinal cord in zebrafish
- Other Figures
- All Figure Page
- Back to All Figure Page
Fig. 1
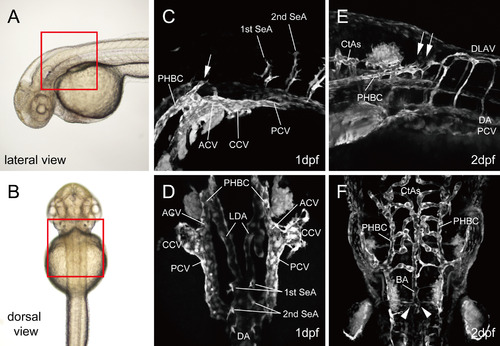
Vascular anatomy of the brain and spinal cord before and after primary integration. Bright field (A and B) and fluorescent (CF) images of Tg(fli1a:EGFP)y1 embryos at 1 dpf (A–D) and 2 dpf (E and F). Lateral (A, C, E) and dorsal (B, D, F) views. Vascular connection between the brain and spinal cord occurred at 1–2 dpf (square region surrounded by red line; A and B). The arrow in C indicates the extending PHBC. Arrows in E indicates the integrative portion. Arrowheads in F indicate the reverse ‘T’ end of the BA. |
Expression Data
Expression Detail
Antibody Labeling
Phenotype Data
Phenotype Detail
Acknowledgments
This image is the copyrighted work of the attributed author or publisher, and
ZFIN has permission only to display this image to its users.
Additional permissions should be obtained from the applicable author or publisher of the image.
Reprinted from Developmental Biology, 406(1), Kimura, E., Isogai, S., Hitomi, J., Integration of vascular Systems between the brain and spinal cord in zebrafish, 40-51, Copyright (2015) with permission from Elsevier. Full text @ Dev. Biol.