
Image
|
Figure Caption
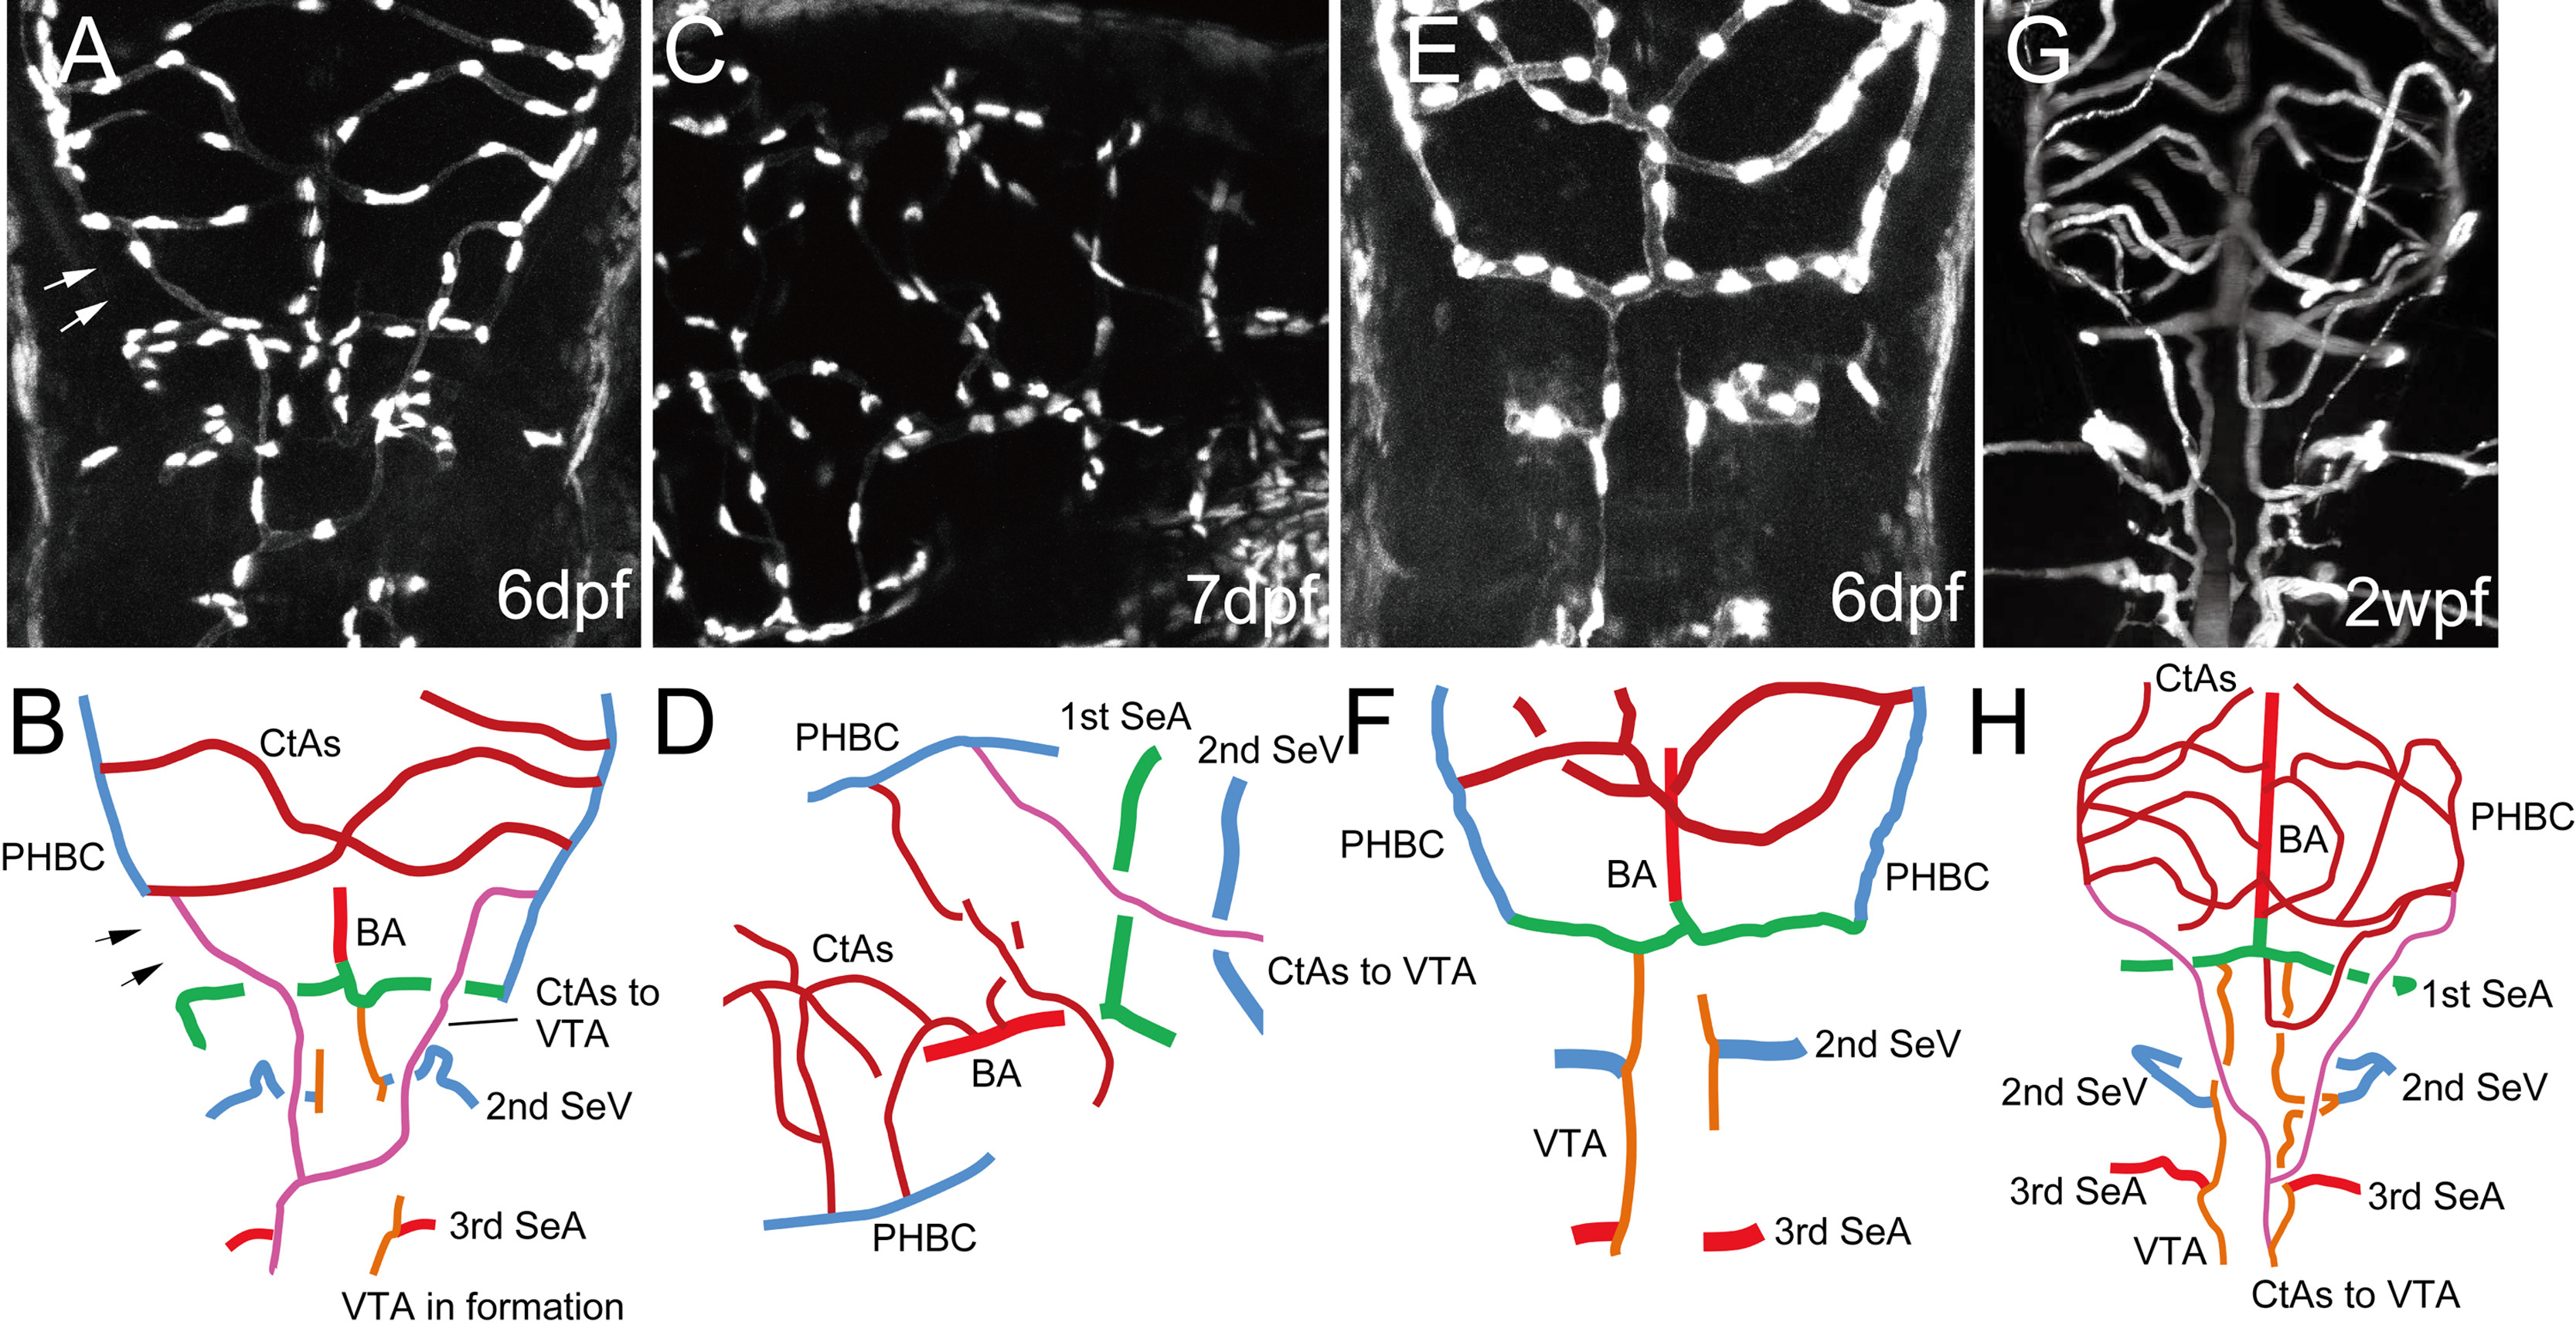
Fig. 6
Remodeling process for the temporal integration of cerebral and spinal vascular systems. Multi-photon microscopic image of Tg(fli1a:EGFP)y7 embryos at 6 (A and E) and 7 dpf (C); microangiography with highlighter ink of casper larvae at 2.5 wpf (G); and their schematic diagrams (B, D, F and H). Dorsal (A, E, and G) and dorso-lateral (C) views. Two pathways, connecting vascular systems, are indicated by colored lines (B, D and H pink lines: supplemental route of CtAs to VTAs; B, F and H brown lines: conventional route of BA-1st SeAs to VTAs). Arrows in A and B indicate the disconnection of the PHBC and DLAV.
Acknowledgments
This image is the copyrighted work of the attributed author or publisher, and
ZFIN has permission only to display this image to its users.
Additional permissions should be obtained from the applicable author or publisher of the image.
Reprinted from Developmental Biology, 406(1), Kimura, E., Isogai, S., Hitomi, J., Integration of vascular Systems between the brain and spinal cord in zebrafish, 40-51, Copyright (2015) with permission from Elsevier. Full text @ Dev. Biol.