
- Title
-
Reverse Effect of Mammalian Hypocalcemic Cortisol in Fish: Cortisol Stimulates Ca Uptake via Glucocorticoid Receptor-Mediated Vitamin D(3) Metabolism
- Authors
- Lin, C.H., Tsai, I.L., Su, C.H., Tseng, D.Y., and Hwang, P.P.
- Source
- Full text @ PLoS One
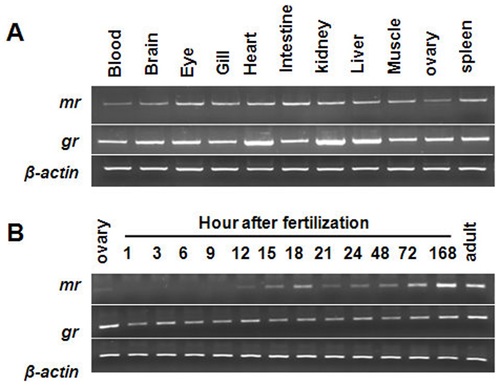
Zebrafish mr and gr expression profiles. Determined by RT-PCR, mr and gr mRNA in various tissues of adults (A), and during developmental stages of embryos (B). β-actin was used as the internal control. |

Ca2+ influx and gene expressions of Ca2+ regulation-related genes. Ca2+ influx (A) and mRNA expression (B) of 3-dpf zebrafish embryos acclimated to low- (0.02 mM Ca2+) or high-Ca2+ (2.00 mM Ca2+) artificial fresh water. mRNA expression analyzed by qPCR and values were normalized to β-actin. Values are the mean ± SEM (n = 4~6). *Significant difference (Student′s t-test, p<0.05). EXPRESSION / LABELING:
|

Effects of exogenous cortisol in 3-dpf zebrafish embryos. Ca2+ content (A), Ca2+ influx (B) and mRNA expressions (C). mRNA expressions were analyzed by qPCR, and values were normalized to β-actin. abcIndicate a significant difference (p<0.05) using Tukey′s multiple-comparison test following one-way ANOVA. Value are the mean ± SEM (n = 6 or 7). EXPRESSION / LABELING:
|

Effects of exogenous cortisol on ecac-expressing cells in 3-dpf zebrafish embryos. In situ hybridization analysis indicated ecac signals (A) and density of ecac-expressing cells (B). abcIndicate a significant difference (p<0.05) using Tukey′s multiple-comparison test following one-way ANOVA. Value are the mean ± SEM (n = 6 or 7). Scale bar 100 μm. EXPRESSION / LABELING:
|

Specificity and effectiveness of MR MO and GR MO. MR and GR cRNA (with GFP fusion) were injected into embryos respectively (A, B), and embryos coinjection of MR/GR MO with cRNA (C, D). Western blot were used to detect GR and MR protein expressions in wild type (WT) and the MO-injected embryos at 3 dpf (E). |

Effects of MR MO and GR MO in 3-dpf zebrafish embryos. Ca2+content (A), Ca2+ influx (B), and mRNA expressions (C). mRNA expressions were analyzed by qPCR and values were normalized to β-actin. abcIndicate a significant difference (p<0.05) using Tukey′s multiple-comparison test following one-way ANOVA. Values are the mean ± SEM (n = 6 or 7). EXPRESSION / LABELING:
PHENOTYPE:
|

Effects of MR MO and GR MO on ecac-expressing cells in 3-dpf zebrafish embryos. In situ hybridization analysis indicated ecac signals (A) and density of ecac-expressing cells (B). abcIndicate a significant difference (p<0.05) using Tukey′s multiple-comparison test following one-way ANOVA. Value are the mean ± SEM (n = 6 or 7). Scale bar 100 μm. EXPRESSION / LABELING:
|
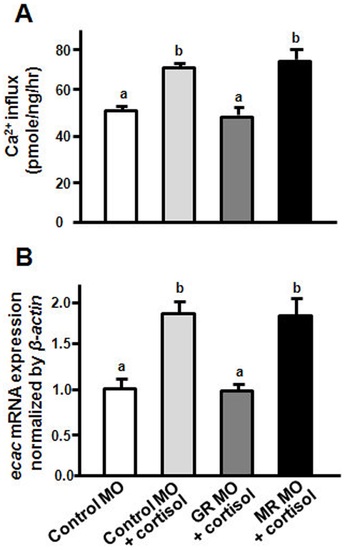
Effects of MR MO and GR MO on zebrafish embryos with cortisol treatment. Ca2+ influx (A) and ecac mRNA expression (B) were analyzed in 3-dpf zebrafish embryos injected with GR MO or MR MO with cortisol treatment. mRNA expressions were analyzed by qPCR, and values were normalized to β-actin. abcIndicate a significant difference (p<0.05) using Tukey′s multiple-comparison test following one-way ANOVA. Values are the mean ± SEM. (n = 6~8). EXPRESSION / LABELING:
|

Effect of MR MO and GR MO on ecac mRNA expression with low Ca2+ treatment. ecac mRNA expression were analyzed in 3-dpf zebrafish embryos injected with GR MO or MR MO with low Ca2+ (0.02 mM; LCa) treatment. mRNA expressions were analyzed by qPCR, and values were normalized to β-actin. abcIndicate a significant difference (p<0.05) using Tukey′s multiple-comparison test following one-way ANOVA. Values are the mean ± SEM. (n = 6~8). |
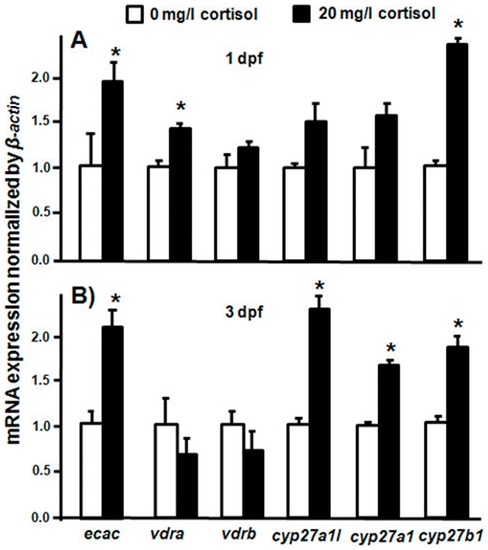
Effects of exogenous cortisol on mRNA expressions of the vitamin D3-related genes. qPCR was used to analyze mRNA expression and values were normalized to β-actin. (A) mRNA expressions in 1-dpf zebrafish embryos. (B) mRNA expressions in 3-dpf zebrafish embryos. abcIndicate a significant difference (p<0.05) using Tukey′s multiple-comparison test following one-way ANOVA. Values are the mean ± SEM (n = 6). EXPRESSION / LABELING:
|

Effects of MR MO and GR MO on mRNA expression of the vitamin D3-related genes. (A) mRNA expressions in 1-dpf zebrafish embryos. (B) mRNA expressions in 3-dpf zebrafish embryos. mRNA expression was analyze by qPCR and values were normalized to β-actin. abcIndicate a significant difference (p<0.05) using Tukey′s multiple-comparison test following one-way ANOVA. Values are the mean ± SEM (n = 6). EXPRESSION / LABELING:
|
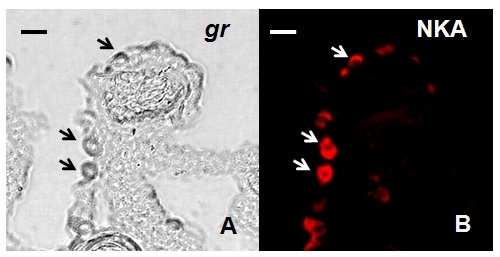
Co-localization of gr mRNA by in situ hybridization with anti-NKA using immunocytochemical analysis of zebrafish gill cryosections. (A) in situ hybridization of gr mRNA; (B) immunocytochemical staining of NKA. Arrow indicated gr mRNA and NKA protein signals at similar area. Scale bar 5 μm. |