
- Title
-
Discovery of a novel prolactin in non-mammalian vertebrates: evolutionary perspectives and its involvement in teleost retina development
- Authors
- Huang, X., Hui, M.N., Liu, Y., Yuen, D.S., Zhang, Y., Chan, W.Y., Lin, H.R., Cheng, S.H., and Cheng, C.H.
- Source
- Full text @ PLoS One

Tissue distribution of PRL2 in zebrafish by real-time PCR. P: pituitary; B: brain; T: testis; I: intestine; K: kidney; L: liver; S: spleen; G: gill; O: ovary; M: muscle; E: eye; H: heart. |
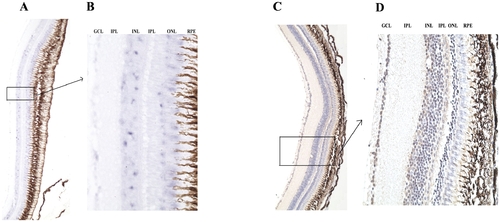
Expression of PRL2 in zebrafish retina. Transverse sections of the zebrafish retina showing expression of zfPRL2 after ISH and IHC. (A and B) ISH signals (gray blue dots) in the GCL, INL and ONL. (C and D) IHC signals (brown dots) in the GCL, INL and ONL. For IHC, nuclei were counterstained with hematoxylin. A and C: x100; B and D: x400. IPL: inner plexiform layer; OPL: outer plexiform layer; RPE: retinal pigmented epithelium. EXPRESSION / LABELING:
|

Expression of PRL2 in zebrafish brain. Horizontal sections of the zebrafish brain showing the expression of zfPRL2 after ISH and IHC. (A) An orientation photomicrograph showing the expression of zfPRL2 by ISH in a horizontal section through the zebrafish brain. (B–E) are photographs at higher magnification of the corresponding boxed areas shown in (A). (F) An orientation photomicrograph showing the expression of zfPRL2 by IHC in a horizontal section through the zebrafish brain. Brain regions with positive signals (brown dots) including dorsal nucleus of ventral telencephalic area/ventral nucleus of ventral telencephalic area (Vd/Vv), nucleus lateralis valvulae/dorsal tegmental nucleus (NLV/DTN) and periventricular gray zone of optic tectum (PGZ) are magnified in photomicrographs (G), (H) and (I) respectively. In both the ISH and IHC results, positive signals (dark blue dots) are observed in the following brain regions: corpus cerebella (CCe); dorsomedial optic tract (DOT); external cellular layer of olfactory bulb including mitral cells (ECL); internal cellular layer of olfactory bulb (ICL); lateral longitudinal fascicle (LLF); NLV/DTN; PGZ; magnocellular preoptic nucleus (PM); parvocellular preoptic nucleus, anterior part (PPa); rhombencephalic ventricle (RV); telencephalic ventricles (TeIV); tectum opticum (TeO); central nucleus of torus semicircularis (TSc); medial division of valvula cerebella (Vam); and ventral nucleus of ventral telencephalic area (Vv). Brain regions were identified on a topological atlas of the zebrafish brain [43]. Nuclei were counterstained with hematoxylin. A and F: x100; B–E: x200; G–I: x400. (J) Western blot showing expression of zfPRL2 in zebrafish brain and eye extracts. EXPRESSION / LABELING:
|

Phenotypic change in the zebrafish eye after knockdown of zfPRL2. Expression of Isl-1 (A–F), Pax6 (G and I) and Six3 (H and J) in the zebrafish retina was studied before and after zfPRL2 MO knockdown. Isl-1 expression, which is present in the GCL and INL of control MO embryos at 48 hpf (A) and 72 hpf (B), is largely reduced in the INL of zfPRL2 MO embryos (C and D). This reduction of expression in the INL can be rescued by injection of zfPRL2 mRNA (E and F). Pax6 (compare G and I) and Six3 (compare H and J) expression is however not affected at 48 hpf after zfPRL2 MO knockdown. After injection of zfPRL2MOs-s, the transcription of zfPRL2 was compromised as demonstrated by the aberrant RT-PCR results (K). PRL2 is expressed after 4 hpf in zebrafish embryos (L). EXPRESSION / LABELING:
|
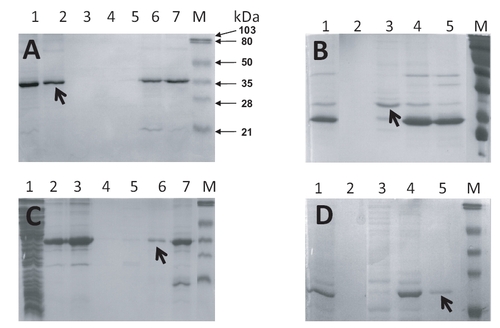
SDS-PAGE gel pictures showing the production of recombinant zebrafish PRL1 (A and B) and PRL2 (C and D). (A) Lane 1: BL21 cell lysate; lane 2: column flow-through; lane 3: column wash with 50 mM PBS; lanes 4–7: column wash with 25 mM, 50 mM, 100 mM and 500 mM imidazole respectively. The arrow indicates the collected zfPRL1-SUMO fusion protein. (B) Lane 1: enzyme digestion mixture of zfPRL1-SUMO fusion protein by SENP1; lane 2: column wash with PBS; lanes 3–5: column wash with 50 mM, 100 mM and 500 mM imidazole respectively. The arrow indicates the collected zfPRL1 protein. (C) Lane 1: BL21 cell lysate; lane 2 column flow-through; lane 3: column wash with 50 mM PBS; lanes 4–7: column wash with 25 mM, 50 mM, 100 mM and 500 mM imidazole respectively. The arrow indicates the collected zfPRL2-SUMO fusion protein. (D) Lane 1: enzyme digestion mixture of zfPRL2-SUMO fusion protein by SENP1; lane 2: column flow-through; lanes 3-5: column wash with 20 mM, 50 mM, 100 mM imidazole respectively. The arrow indicates the collected zfPRL2 protein. M stands for protein markers used in the SDS-PAGE. |