
|
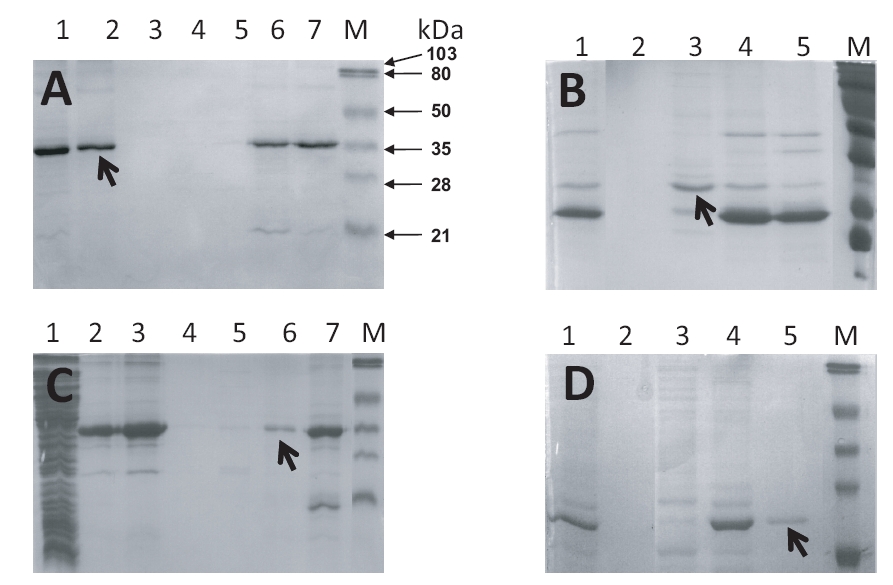
Fig. S15 SDS-PAGE gel pictures showing the production of recombinant zebrafish PRL1 (A and B) and PRL2 (C and D). (A) Lane 1: BL21 cell lysate; lane 2: column flow-through; lane 3: column wash with 50 mM PBS; lanes 4–7: column wash with 25 mM, 50 mM, 100 mM and 500 mM imidazole respectively. The arrow indicates the collected zfPRL1-SUMO fusion protein. (B) Lane 1: enzyme digestion mixture of zfPRL1-SUMO fusion protein by SENP1; lane 2: column wash with PBS; lanes 3–5: column wash with 50 mM, 100 mM and 500 mM imidazole respectively. The arrow indicates the collected zfPRL1 protein. (C) Lane 1: BL21 cell lysate; lane 2 column flow-through; lane 3: column wash with 50 mM PBS; lanes 4–7: column wash with 25 mM, 50 mM, 100 mM and 500 mM imidazole respectively. The arrow indicates the collected zfPRL2-SUMO fusion protein. (D) Lane 1: enzyme digestion mixture of zfPRL2-SUMO fusion protein by SENP1; lane 2: column flow-through; lanes 3-5: column wash with 20 mM, 50 mM, 100 mM imidazole respectively. The arrow indicates the collected zfPRL2 protein. M stands for protein markers used in the SDS-PAGE.