
- Title
-
The endosomal protein Appl1 mediates Akt substrate specificity and cell survival in vertebrate development
- Authors
- Schenck, A., Goto-Silva, L., Collinet, C., Rhinn, M., Giner, A., Habermann, B., Brand, M., and Zerial, M.
- Source
- Full text @ Cell
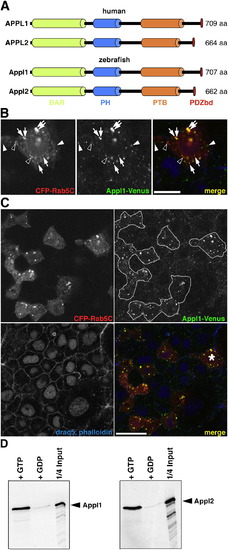
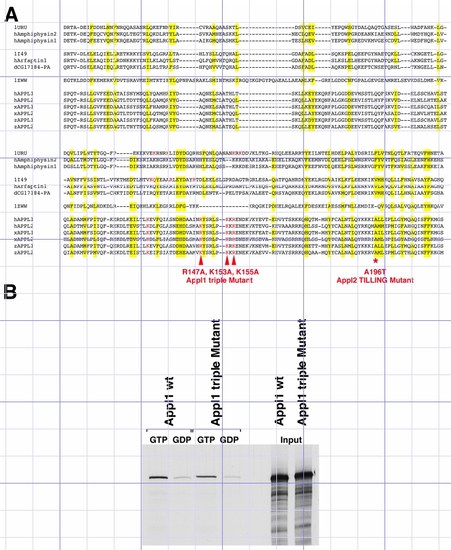
Appl Proteins, Their Localization, and Biochemical Properties Are Conserved in Zebrafish |
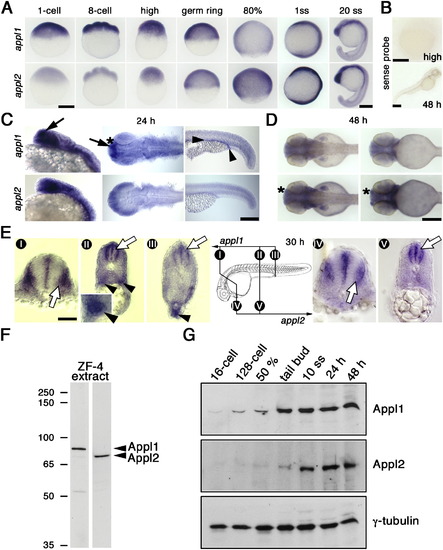
appl Developmental Expression Profiles |
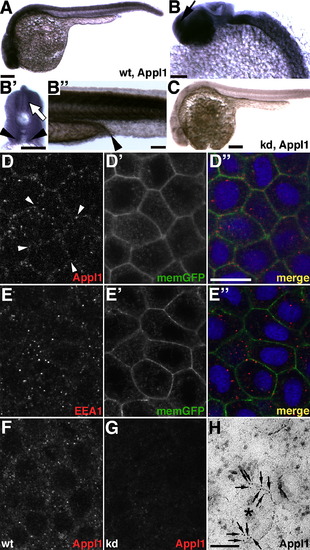
Appl1 Protein and Endosomes during Development EXPRESSION / LABELING:
|
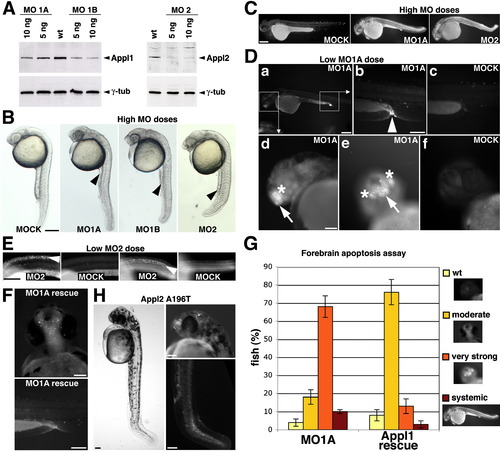
Loss of Appls Causes Apoptosis EXPRESSION / LABELING:
|
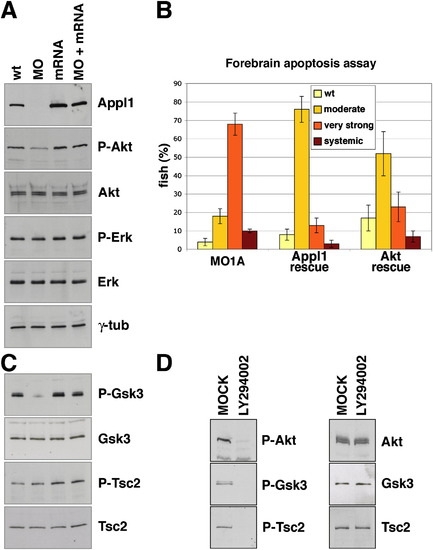
Appl1 Regulates Akt Activity, Akt Substrate Specificity, and Akt-Dependent Survival in Zebrafish Development |
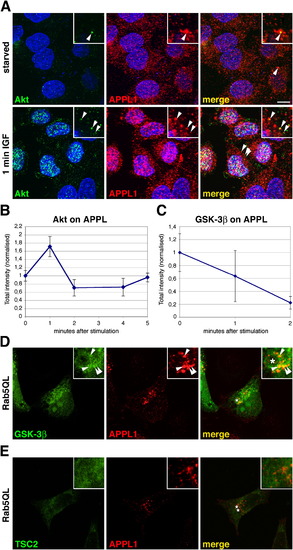
Akt and GSK-3β, but Not TSC2, Colocalize with APPL1 on Endosomes |
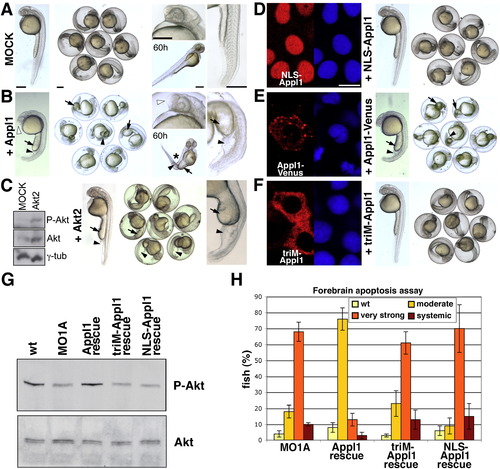
Appl1-Mediated Gain-of-Function Phenotypes and Survival Signaling Depend on Its Endosomal Localization |
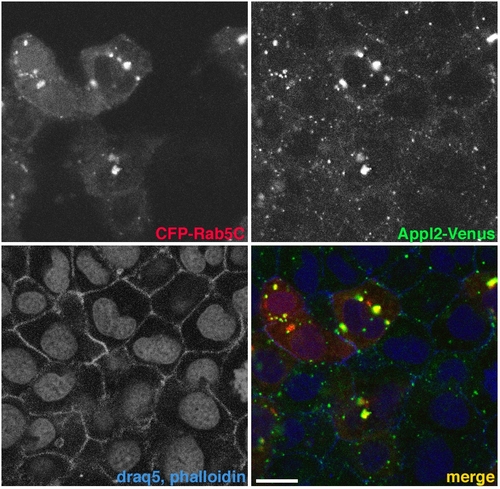
Appl2 localization and recruitment to Rab5C-labeled endosomes. |
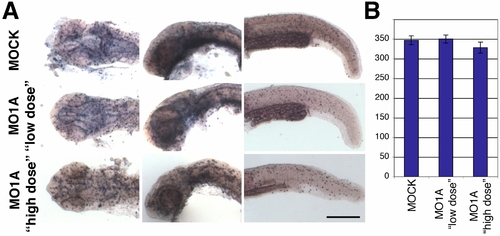
appl1 morphants show no significant differences in cell proliferation. |

Concurrent downregulation of p53 does not affect APPL1 knock-down induced apoptosis. PHENOTYPE:
|
Appl mutants |

Appl1 and Appl2 double knock-down PHENOTYPE:
|

Unillustrated author statements PHENOTYPE:
|
Reprinted from Cell, 133(3), Schenck, A., Goto-Silva, L., Collinet, C., Rhinn, M., Giner, A., Habermann, B., Brand, M., and Zerial, M., The endosomal protein Appl1 mediates Akt substrate specificity and cell survival in vertebrate development, 486-497, Copyright (2008) with permission from Elsevier. Full text @ Cell