
- Title
-
Four and a Half LIM Domains 1b (Fhl1b) Is Essential for Regulating the Liver versus Pancreas Fate Decision and for β-Cell Regeneration
- Authors
- Xu, J., Cui, J., Del Campo, A., Shin, C.H.
- Source
- Full text @ PLoS Genet.
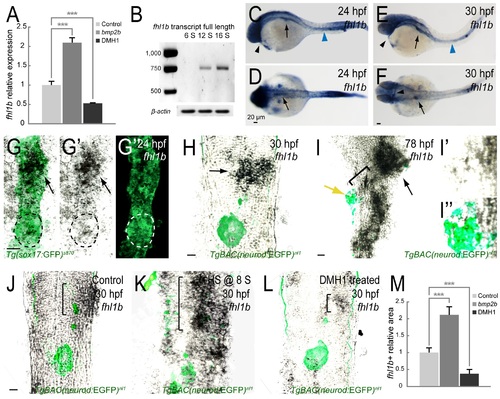
fhl1b is a target of the Bmp2b pathway. (A) Quantitative real-time PCR analysis of fhl1b in bmp2b-overexpressing or DMH1-treated embryos at 20 hours-post-fertilization (hpf). Gene expression was normalized to that of β-actin and presented as fold changes (mean±SD) against control expression. Asterisks indicate statistical significance: ***, P < 0.001. (B) fhl1b full-length transcript, which was detected by RT-qPCR analysis of whole embryos, starts to be expressed from the 12-somite stage onwards. (C-F) Whole-mount in situ hybridization showing the expression of fhl1b at 24 (C-D) and 30 (E-F) hpf. At 24 hpf (C-D), fhl1b is expressed in the anterior part of the endoderm, which corresponds to the prospective liver anlage (black arrows). Additionally, fhl1b is expressed in the pronephric duct (blue arrowhead) and heart (black arrowhead). At 30 hpf (E-F), fhl1b continues to be highly expressed in the liver (black arrows) and remains to be expressed in the pronephric duct (blue arrowhead) and heart (black arrowheads). (G-G′′) Double antibody and in situ hybridization staining of fhl1b at 24 hpf in Tg(sox17:GFP)s870 embryos. fhl1b is primarily expressed in the anterior part of the endoderm, which corresponds to the prospective liver anlage (black arrows). White and black dotted circles locate the dorsal pancreatic bud, which gives rise exclusively to the principal islet, a cluster of endocrine cells. A merged view of G′ and G′′ is shown in G. (H-I′′) Double antibody and in situ hybridization staining of fhl1b in TgBAC(neurod:EGFP)nl1 embryos at 30 (H) and 78 (I-I′′) hpf. TgBAC(neurod:EGFP)nl1 expression marks the posteriorly located pancreatic endocrine cells. At 30 hpf (H), fhl1b is highly expressed in the liver (black arrow). At 78 hpf (I-I′′), the level of fhl1b expression is continuously high in the liver (black arrow) and in patches of cells in the distal intestine, low in the HPD system (black bracket), and absent in most of the pancreatic cells except for a few cells in the periphery of the principal islet (yellow arrow). In the principal islet, fhl1b expression is confined to the peripheral boundary and does not significantly overlap with the TgBAC(neurod:EGFP)nl1 expression. Magnified images of fhl1b and TgBAC(neurod:EGFP)nl1expression in the principal islet are shown in I′ and I′′. (J-L) Double antibody and in situ hybridization staining showing the endogenous expression of fhl1b in the liver (black brackets), comparing control (J), bmp2b-overexpressing (K), and DMH1-treated (L) TgBAC(neurod:EGFP)nl1 embryos at 30 hpf. fhl1b expression was greatly expanded when bmp2b expression was induced at the 8-somite stage (K), but was reduced in DMH1-treated embryos (L). (M) Quantification of the fhl1b-positive in situ hybridization signal at 30 hpf. The areas of fhl1b-positive signal were selected and measured using Image J with normalization to control. 3 individual embryos were analyzed for each condition. Asterisks indicate statistical significance: ***, P < 0.001. G-L, confocal single-plane in situ hybridization images combined with the projection images of Tg(sox17:GFP)s870 (G-G′′) and TgBAC(neurod:EGFP)nl1 (H-L) expression, ventral views, anterior to the top. C and E, lateral views, anterior to the left. D and F, dorsal views, anterior to the left. n = 10 per each time point and condition. Scale bars, 20 µm. EXPRESSION / LABELING:
PHENOTYPE:
|
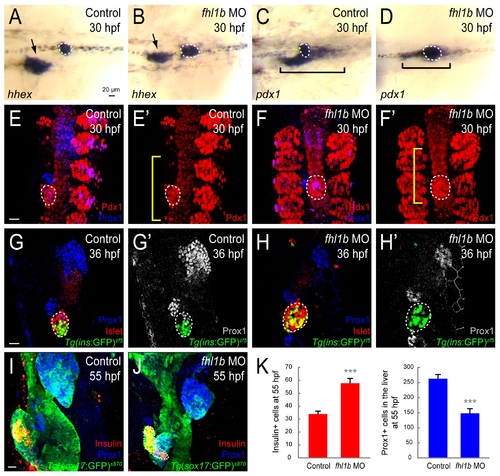
Loss of Fhl1b activity enhances induction of pancreatic cells and compromises liver specification. (A-D) Whole-mount in situ hybridization showing the expression of hhex (A and B) and pdx1 (C and D), comparing control embryos (A and C) and fhl1b morphants (B and D) at 30 hpf. hhex is expressed in the liver (black arrows) and the dorsal pancreatic bud (white dotted circles). pdx1 is expressed in the developing pancreas including the dorsal pancreatic bud (white dotted circles) and intestine (black brackets), but not in the liver. hhex expression was reduced in the liver of fhl1b morphants, while expanded in the dorsal pancreatic bud (B). pdx1 expression in the dorsal pancreatic bud was also expanded, while its expression in the intestinal bulb primordium appeared to be reduced in fhl1b morphants (D) compared to that of control embryos (C). (E–F′) Confocal images of control embryos (E and E′) and fhl1b morphants (F and F′) at 30 hpf, stained for Pdx1 (red; expression in the dorsal pancreatic bud is outlined by white dotted circles) and Prox1 (blue). The somites are also Pdx1 positive. Compared to that of control embryos (E and E′), in fhl1b morphants (F and F′), the Pdx1 expression domain in the dorsal pancreatic bud was expanded, while the Prox1 expression domain was reduced. Note that the Pdx1 expression domain in the intestinal primordium (yellow brackets) appeared to be decreased in morphants (F′). (G-H′) Confocal images of Tg(ins:GFP)zf5 control embryos (G and G′) and fhl1b morphants (H and H′) at 36 hpf, stained for Islet (red; expression in the dorsal pancreatic bud is outlined by white dotted circles) and Prox1 (blue in G and H; grey in G′ and H′). In fhl1b morphants (H and H′), the Prox1 expression domain was greatly reduced, whereas the number of Tg(ins:GFP)zf5- and Islet-expressing cells was increased. (I and J) Confocal images of Tg(sox17:GFP)s870 control embryos (I) and fhl1b morphants (J) at 55 hpf, stained for Insulin (red; outlined by white dotted circles) and Prox1 (blue). fhl1b morphants (J) continuously exhibited an enlarged Insulin-expressing β-cell population with a reduced number of Prox1-positive cells in the liver. (K) Quantification of the number (mean±SD) of Insulin-positive cells in the pancreas (red) and Prox1-positive cells in the liver (blue) at 55 hpf. 33.9±2.1 cells were Insulin-positive in control embryos, whereas 57.8±3.6 cells were Insulin-positive in fhl1b morphants. 148.0±15.2 cells expressed Prox1 in fhl1b morphants, while 262.7±14.0 cells were Prox1-positive in control embryos. Cells in 20 planes of confocal images from 5 individual embryos were counted. Asterisks indicate statistical significance: ***, P < 0.001. A-D, dorsal views, anterior to the left. E-J, confocal projection images, ventral views, anterior to the top. Scale bars, 20 µm. |

Decreased Fhl1b activity augments induction of pancreatic endocrine cells. (A-H) Confocal images showing Tg(P0-pax6b:GFP)ulg515 (A and B, green), Insulin (C and D, red), Somatostatin (E and F, grey), and Glucagon (G and H, blue) expression at 30 hpf, comparing control embryos (A, C, E, and G) and fhl1b morphants (B, D, F, and H). The number of Tg(P0-pax6b:GFP)ulg515 (B)- and Insulin (D)-expressing cells was significantly increased in fhl1b morphants compared to that of control embryos (A and C, respectively). The number of Somatostatin-expressing cells was also increased (F), while that of Glucagon-expressing cells appeared unaffected (H) in fhl1b morphants compared to that of control embryos (E and G, respectively). (I) Quantification of the number (mean±SD) of total and individual pancreatic endocrine hormone-expressing cells, comparing that of control embryos and fhl1b morphants at 30 hpf. The absolute number of Tg(P0-pax6b:GFP)ulg515-, Insulin-, and Somatostatin-expressing cells was increased from 82.6±4.5, 30.6±1.5, and 20.7±0.8, respectively, in control embryos, to 103±2.0, 44.6±2.0, and 26.7±2.0, respectively, in fhl1b morphants, while that of Glucagon-expressing cells appeared unaffected (26.5±0.7 cells in controls vs. 24.6±1.5 cells in fhl1b morphants). Cells in 20 planes of confocal images from 5 individual embryos were counted. Asterisks indicate statistical significance: **, P < 0.01; ***, P < 0.001. (J-K′) Confocal images of Tg(ins:GFP)zf5;Tg(ins:dsRed)m1018 control embryos (J and J′) and fhl1b morphants (K and K′) at 48 hpf. Compared with the control embryos (J), fhl1b morphants showed an increased number of GFP-only-positive β-cells (K, white arrows). (L) Quantification of the number (mean±SD) of GFP- and dsRed-double positive (yellow) and GFP-only-positive (green) β-cells, comparing that of control embryos and fhl1b morphants at 48 hpf. In control embryos, 5.0±0.7 β-cells were GFP-only-positive, while 12.2±2.3 β-cells were GFP-only-positive in fhl1b morphants. Cells in 20 planes of confocal images from 5 individual embryos were counted. Asterisks indicate statistical significance: ***, P < 0.001. A-H and J-K′, confocal projection images, ventral views, anterior to the top. Scale bars, 20 µm. |
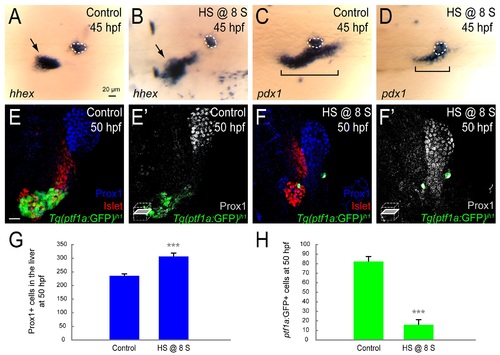
Increased Fhl1b activity suppresses specification of pancreatic cells and induces liver. (A-D) Whole-mount in situ hybridization showing the expression of hhex (A and B) and pdx1 (C and D), comparing control embryos (A and C) and fhl1b-overexpressing embryos (B and D, heat shock applied at the 8-somite stage) at 45 hpf. hhex is expressed in the liver (black arrows) and the dorsal pancreatic bud (white dotted circles). pdx1 is expressed in the developing pancreas including the dorsal pancreatic bud (white dotted circles) and intestine (black brackets), but not in the liver. When fhl1b expression was induced at the 8-somite stage, hhex expression was greatly expanded in the liver (B, black arrow), while pdx1 expression in the developing gut was reduced (D, black bracket). hhex and pdx1 expression in the dorsal pancreatic bud in fhl1b-overexpressing embryos was comparable to that of control embryos. (E-F′) Confocal images showing Islet (red), Prox1 (blue in E and F; grey in E′ and F′), and Tg(ptf1a:GFP)jh1 (green) expression at 50 hpf, comparing control embryos (E and E′) and fhl1b-overexpressing embryos (F and F′, heat shock applied at the 8-somite stage). When fhl1b expression was induced at the 8-somite stage (F and F′), the Prox1 expression domain was expanded, whereas Tg(ptf1a:GFP)jh1 expression was drastically reduced. (G) Quantification of the number (mean±SD) of Prox1-positive cells in the liver at 50 hpf. 235.5±7.3 cells were Prox1-positive in control embryos, while 306.5±12.6 cells were Prox1-positive in fhl1b-overexpressing embryos (heat shock applied at the 8-somite stage). Cells in 20 planes of confocal images from 5 individual embryos were counted. Asterisks indicate statistical significance: ***, P < 0.001. (H) Quantification of the number (mean±SD) of Tg(ptf1a:GFP)jh1-expressing cells in the exocrine pancreas at 50 hpf. The number of Tg(ptf1a:GFP)jh1-expressing cells decreased from 82.2±6.4 in control embryos to 16.0±5.2 in fhl1b-overexpressing embryos (heat shock applied at the 8-somite stage). Cells in 20 planes of confocal images from 5 individual embryos were counted. Asterisks indicate statistical significance: ***, P < 0.001. A-D, dorsal views, anterior to the left. E and F, confocal projection images; E′ and F′, confocal single-plane images, ventral views, anterior to the top. Scale bars, 20 µm. |
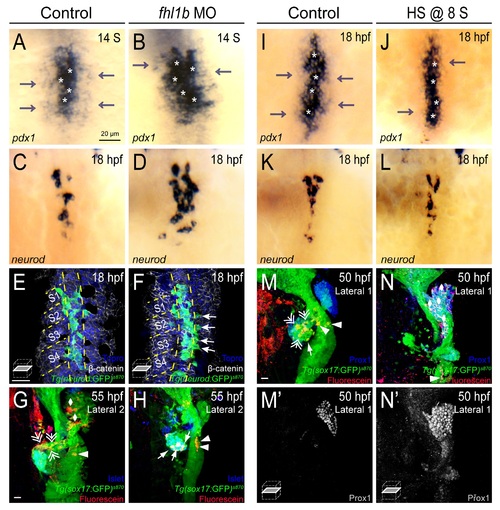
Fhl1b regulates the patterning and subsequent fate of the medial and lateral endodermal progenitors. (A-D) Whole-mount in situ hybridization showing the expression of pdx1 (A and B) and neurod (C and D), comparing that of control embryos (A and C) and fhl1b morphants (B and D) at the 14-somite stage (A and B) and 18 hpf (C and D). pdx1 is expressed at high levels in the most medial cells (white asterisks) and at low levels in the lateral cells (gray arrows). neurod is expressed in the high-level pdx1-expressing cells. In fhl1b morphants, high levels of pdx1 (white asterisks) and neurod expression were expanded laterally (B and D). (E-F) Ventral confocal images showing TgBAC(neurod:EGFP)nl1, β-catenin (white), and Topro (blue) at 18 hpf (the notochord is outlined by yellow dashed lines). Somites are numbered from anterior to posterior (S1-S4). (E) In control embryos, TgBAC(neurod:EGFP)nl1-expressing cells are located close to the notochord. (F) Ectopic TgBAC(neurod:EGFP)nl1-expressing cells were found in lateral endodermal regions in fhl1b morphants (white arrows). (G and H) Confocal images of Tg(sox17:GFP)s870 embryos at 55 hpf, stained for uncaged-Fluorescein (red) and Islet (blue). In control embryos (G), lateral 2 (L2) cells gave rise to the liver (white rhombi), intestine (white arrowhead), and exocrine pancreas (white double arrows), but rarely gave rise to the endocrine pancreas. In fhl1b morphants (H), L2 cells contributed to the Islet-positive pancreatic endocrine cells (white arrows), but not to the liver or exocrine pancreas. (I-L) Whole-mount in situ hybridization showing the expression of pdx1 (I and J) and neurod (K and L) at 18 hpf, comparing control embryos (I and K) and fhl1b-overexpressing embryos (J and L, heat shock applied at the 8-somite stage). In embryos induced to overexpress fhl1b at the 8-somite stage (J and L), neurod and high levels of pdx1 expression (white asterisks in J) were maintained, while low levels of pdx1 expression (gray arrows) were reduced. (M-N′) Confocal images of Tg(sox17:GFP)s870 embryos at 50 hpf, stained for uncaged-Fluorescein (red) and Prox1 (blue in M and N; grey in M′ and N′). In control embryos (M and M′), lateral 1 (L1) cells gave rise to the exocrine pancreas (white double arrows) and the intestine (white arrowheads), but not to the liver. In embryos induced to overexpress fhl1b at the 8-somite stage (N and N′), L1 cells mostly contributed to the Prox1-positive liver cells (white rhombi). A-D and I-L, dorsal views, anterior to the top. G-H and M-N, confocal projection images; E-F, M′, and N′, confocal single-plane images, ventral views, anterior to the top. Scale bars, 20 µm. EXPRESSION / LABELING:
PHENOTYPE:
|
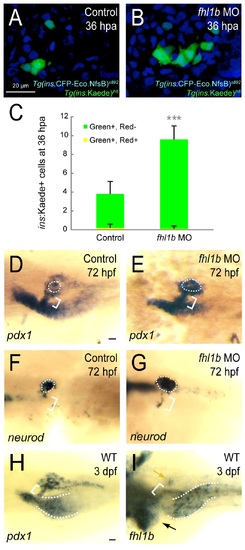
Reduction of Fhl1b activity enhances the capacity of β-cell regeneration. (A and B) Confocal images of [Tg(ins:CFP-NTR)s892; Tg(ins:Kaede)jh6] control larvae (A) and fhl1b MO-injected (B) larvae at 36 hours-post-ablation (hpa) stained with Topro (blue). A greater number of β-cells regenerated in recovering fhl1b-MO injected larvae (B) compared to that of control larvae (A). (C) Quantification of the number (mean±SD) of regenerated and survived β-cells. After photoconversion and ablation, the survived β-cells are red and green (yielding a combined color of yellow), whereas the newly formed β-cells are green only. 3.8±1.3 β-cells were green-only-positive in control recovering larvae, while 9.6±1.4 β-cells expressed as green-only in fhl1b-MO injected recovering larvae. Almost no β-cells survived the ablation in both the control and fhl1b-MO injected recovering larvae. Cells in 20 planes of confocal images from 10 individual larvae were counted. Asterisks indicate statistical significance: ***, P < 0.001. (D-G) Whole-mount in situ hybridization showing the expression of pdx1 (D and E) and neurod (F and G) at 72 hpf, comparing control embryos (D and F) and fhl1b morphants (E and G). pdx1 is expressed in the pancreas including the principal islet (white dotted circles), the HPD system (white brackets), and the proximal intestine, but not in the liver. neurod is expressed mainly in the principal islet (white dotted circles) with slight expression in the HPD system (white brackets). pdx1 (E) and neurod (G) expression in the principal islet and the HPD system was greatly increased in fhl1b morphants. (H-I) Whole-mount in situ hybridization showing the expression of pdx1 (H) and fhl1b (I) in wild-type embryos at 3 dpf. (H) pdx1 is expressed in the pancreas including the principal islet, the HPD system (white bracket), and the proximal intestine (white dotted line), but not in the liver. (I) fhl1b is expressed at high levels in the liver cells (black arrow), which never express pdx1, whereas the HPD system (white bracket) expresses low levels of fhl1b. Most pancreatic cells except for a few cells in the principal islet (yellow arrow) do not express fhl1b. The distal intestine also expresses fhl1b (white dotted lines). A-B, confocal projection images, ventral views, anterior to the top. D-I, dorsal views, anterior to the left. Scale bars, 20 µm. EXPRESSION / LABELING:
PHENOTYPE:
|
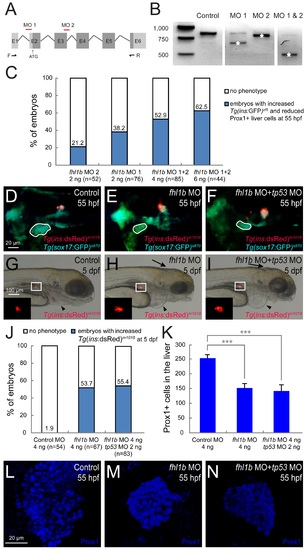
Specificity of fhl1b morpholinos. (A) Schematic diagram of fhl1b genomic structure and targeting positions of fhl1b MOs (red lines). Black arrows indicate the position of primers (F and R) used for RT-PCR analysis shown in (B). E1-E6: exon 1 to exon 6. Dark grey, coding regions; Light grey, untranslated regions. (B) RT-PCR analysis of fhl1b knockdown efficiency. Both MO 1 and MO 2 blocked the endogenous splice site of fhl1b and, as a result, either a deletion of exon 2 (MO 1, white asterisk) or a formation of a cryptic splice form of exon 3 (MO 2, white asterisk) occurred, while a combination of MO 1 and 2 led to deletion of both exon 2 and 3 (MO 1 & 2, white asterisk). (C) The percentages of embryos are given for each single MO or combination of MOs based upon the expression domain of Tg(ins:GFP)zf5 in the pancreas and Prox1 in the liver at 55 hpf. The embryos were scored as having a “reduced” or “increased” expression domain when the expression area of each marker was distinctly (> 25%) smaller or larger than that of the control embryos based upon the calculation using ImageJ. (D-F) Fluorescent images of Tg(ins:dsRed)m1018 and Tg(sox17:GFP)s870 expression showing that the developmental defects of the liver (white dotted circles) and β-cell formation in single fhl1b morphants (E) was comparable to double fhl1b/tp53 morphants (F) at 55 hpf (n = 52, control; n = 64, single fhl1b morphants; n = 72, double fhl1b/tp53 morphants). (G-I) Bright-field images combined with fluorescent images showing the overall morphology of embryos and Tg(ins:dsRed)m1018 expression (red) in control (G), single fhl1b morphants (H), and double fhl1b/tp53 morphants (I) at 5 dpf. The enlarged Tg(ins:dsRed)m1018 -expressing cell population (white squares and insets) in single fhl1b morphants (H) was similar to that in embryos co-injected with fhl1b and tp53 MOs (I). Note that potential off-target ventricle lumen inflation defects in the brain of single fhl1b morphants were attenuated by co-knockdown of tp53 (black arrows), whereas pericardial edema persisted both in single fhl1b morphants and double fhl1b/tp53 morphants (black arrowheads). (J) Quantification of the results in G-I. The embryos were scored as having an “increased” expression domain when the expression area of Tg(ins:dsRed)m1018 was distinctly (> 25%) larger than that of the control embryos based upon the calculation using ImageJ. (K) Quantification of the number (mean±SD) of Prox1-positive cells in the liver at 55 hpf. 252.6±11.5 cells were Prox1-positive in control embryos, while 151.3±16.2 and 142.3±17.4 cells expressed Prox1 in single fhl1b morphants and double fhl1b/tp53 morphants, respectively (P = 0.0009 and P = 0007, respectively). Cells in 20 planes of confocal images from 5 individual embryos were counted. Asterisks indicate statistical significance: ***, P < 0.001. (L-N) Confocal images of control embryos (L), single fhl1b morphants (M), and double fhl1b/tp53 morphants (N) at 55 hpf, stained for Prox1 (blue). The reduced Prox1-expressing cell population in single fhl1b morphants (M) was similar to that in embryos co-injected with fhl1b and tp53 MOs (N). D-F, dorsal views, anterior to the left. G-I, lateral views, anterior to the right. L-N, confocal projection images, ventral views, anterior to the top. Scale bars: D-F and L-N, 20 µM; G-I, 100 µM. |

Loss of Fhl1b activity compromises liver specification and enhances induction of Pdx1-positive cells in the dorsal pancreatic bud. (A-B′) Confocal images of Tg(sox17:GFP)s870 control embryos (A and A2) and fhl1b morphants (B and B2) at 30 hpf, stained for Pdx1 (red; dorsal pancreatic bud is outlined by white dotted circles) and Prox1 (blue in A and B; grey in A′ and B′). The somites are also Pdx1 positive. Compared to control embryos (A and A2), in fhl1b morphants (B and B2), the Pdx1 expression domain in the dorsal pancreatic bud was expanded, while the Prox1 expression domain was significantly reduced. (C-D) Quantification of the number (mean±SD) of Pdx1-positive cells in the pancreas at 30 hpf. Cells in 20 planes of confocal images from 5 individual embryos were counted. Asterisks indicate statistical significance: ***, P < 0.001. A-B′, confocal projection images, ventral views, anterior to the top. Scale bar, 20 µm. |
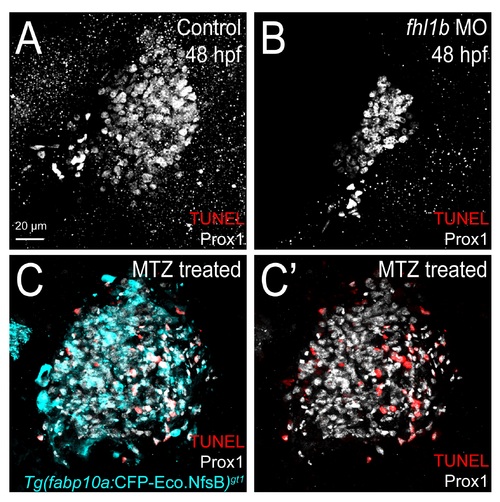
Cell death does not contribute to the reduction of liver size upon fhl1b depletion. (A-B) TUNEL labeling (red) combined with anti-Prox1 immunostaining (grey) revealed that no TUNEL-positive liver cells were observed both in fhl1b morphants and control embryos at 48 hpf. (C-C′) As a control, Tg(fabp10a:CFP-NTR)gt1 embryos were used. Treating metronidazole (MTZ) caused apoptosis in a large number of hepatocytes. A-C′, confocal projection images, ventral views, anterior to the top. Scale bar, 20 µm. |
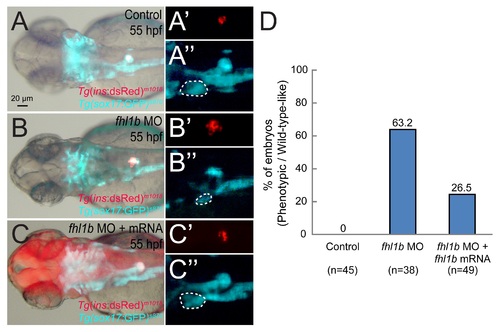
fhl1b mRNA injection partially rescues the effect of fhl1b MO knockdown. (A-C′′) The developmental defects of the liver (A-C and white dotted circles in A′′-C′′) and β-cell formation (A-C and A′-C′) in fhl1b morphants (B-B′′) could be partially rescued by injection of fhl1b-P2A-mcherry mRNA (C-C′′), restoring liver size and the β-cell population to a degree comparable to that of control embryos (A-A′′) at 55 hpf. Fhl1b translation was monitored by mCherry expression as shown in C. (D) Quantification of the results in A-C′′. The embryos were scored as having a “reduced” or “increased” expression domain when the expression area of Tg(ins:dsRed)m1018 and Tg(sox17:GFP)s870 was distinctly (> 25%) smaller or larger than that of the control embryos based upon the calculation using ImageJ. A-C, bright-field images combined with fluorescent image of Tg(ins:dsRed)m1018 and Tg(sox17:GFP)s870 expression. A′-C′′, fluorescent images of Tg(ins:dsRed)m1018 and Tg(sox17:GFP)s870 expression. Dorsal views, anterior to the left. Scale bar, 20 µm. |
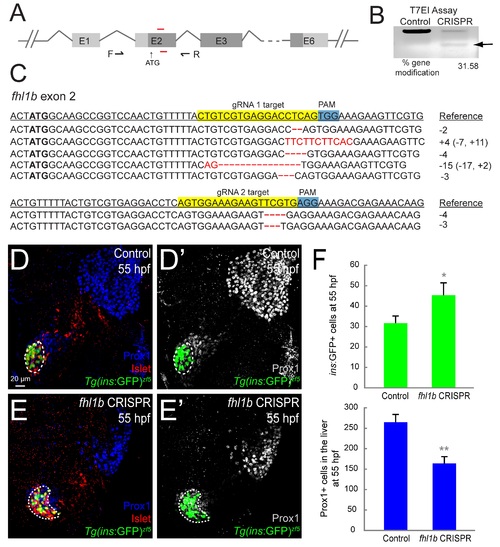
Cas9/gRNAs induces indels in the fhl1b locus in zebrafish. (A) Illustration showing the position of two gRNA-targeting sites (red lines) in the fhl1b locus in zebrafish. Black arrows indicate the position of primers (F and R) used for sequencing to identify indels shown in (C). (B) Representative T7EI assay showing the efficiency of Cas9-mediated cleavage in a single embryo at 55 hpf. (C) Representative Sanger sequencing results of the PCR amplicons of 4 individual embryos at 55 hpf, showing indels induced by Cas9/gRNA in the targeted fhl1b locus. Twenty to thirty clones were sequenced for each embryo. The wild-type sequence is shown at the top with the target sites highlighted in yellow and the PAM sequences (TGG and AGG) highlighted in blue. Deletions are shown as red dashed lines and insertions are highlighted in red. The net change in length caused by each indel is to the right of each sequence (+, insertion; -, deletion). (D-E′) Confocal images of Tg(ins:GFP)zf5 control embryos (D and D′) and Cas9/gRNA-induced mutant embryos (E and E′) at 55 hpf, stained for Prox1 (blue in D and E; grey in D′ and E′) and Islet (red; expression in the dorsal pancreatic bud is outlined by white dotted circles). Cas9/gRNA-induced mutant embryos exhibited an enlarged Insulin-expressing β-cell population with a reduced number of Prox1-positive cells in the liver, phenocopying that of the fhl1b MO knockdown embryos. (F) Quantification of the number (mean±SD) of Insulin-positive cells in the pancreas (green) and Prox1-positive cells in the liver (blue) at 55 hpf. 31.6±3.5 cells were Insulin-positive in control embryos, whereas 45.3±6.0 cells expressed Insulin in Cas9/gRNA-induced mutant embryos. 164±16.5 cells expressed Prox1 in Cas9/gRNA-induced mutant embryos, while 265±18.6 cells were Prox1-positive in control embryos. Cells in 20 planes of confocal images from 5 individual embryos were counted. Asterisks indicate statistical significance: *, P < 0.05, **, P < 0.01. D-E′, confocal projection images, ventral views, anterior to the top. Scale bar, 20 µm. |
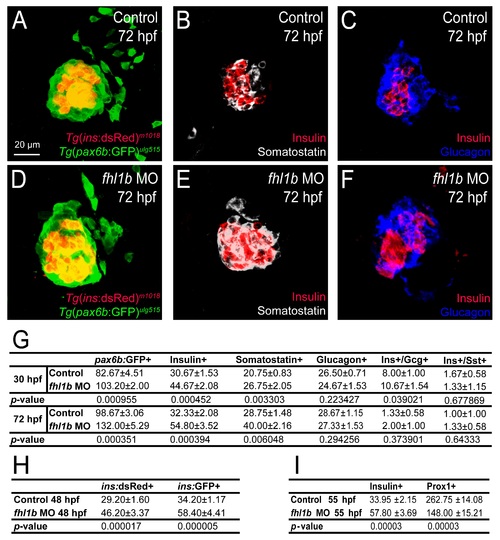
Decreased Fhl1b activity increases the number of pancreatic endocrine cells. (A-F) Confocal images showing Tg(ins:dsRed)m1018 (A and D) or Insulin (B-C, E-F, red) expression with Tg(P0-pax6b:GFP)ulg515 (A and D, green), Somatostatin (B and E, grey), or Glucagon (C and F, blue) expression at 72 hpf, comparing control embryos (A-C) and fhl1b morphants (D-F). The number of Tg(ins:dsRed)m1018- or Insulin-expressing cells was significantly increased in fhl1b morphants (D-F) compared to that of control embryos (A-C). The number of Tg(P0-pax6b:GFP)ulg515- and Somatostatin-expressing cells was also increased (D and E, respectively), whereas that of Glucagon-expressing cells appeared unaffected (F) in fhl1b morphants compared to control embryos (A, B, and C, respectively). (G) Quantification of the number (mean±SD) of total and individual pancreatic endocrine hormone-expressing cells, comparing control embryos and fhl1b morphants at 30 and 72 hpf. (H) Quantification of the number (mean±SD) of dsRed- and GFP-positive β-cells, comparing control embryos and fhl1b morphants at 48 hpf. (I) Quantification of the number (mean±SD) of Insulin-positive cells in the pancreas and Prox1-positive cells in the liver at 55 hpf. A-F, confocal projection images, ventral views, anterior to the top. G-I, cells in 20 planes of confocal images from 5 individual embryos were counted. Scale bar, 20 µm. |
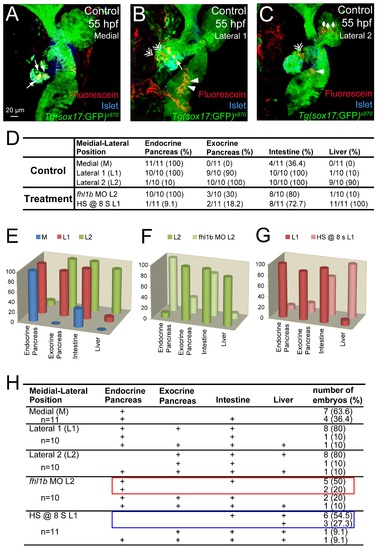
Endodermal progenitors contribute to distinct endodermal tissues based on their M-L position and the activity of Fhl1b. (A-C) Confocal images of Tg(sox17:GFP)s870 embryos at 55 hpf, stained for Islet (blue) and uncaged-Fluorescein (red), showing the progeny of the medial (A), lateral 1 (B) and lateral 2 (C) cells. Medial cells (A) mostly gave rise to pancreatic endocrine cells (white arrows). Lateral 1 cells (B) gave rise to pancreatic exocrine (white double arrows), endocrine (white arrow), and intestinal (white arrowheads) cells. Lateral 2 cells (C) gave rise to liver (white rhombi), intestine (white arrowhead), and pancreatic exocrine cells (white double arrow). (D-H) The numbers and the percentages of embryos that showed incorporation into a given tissue type in each specific position, comparing control embryos (D, E, F (as L2), G (as L1), and H) as well as fhl1b morphants and embryos induced to overexpress fhl1b at the 8-somite stage (D, F (as fhl1b MO L2), G (as HS @ 8s L1), and H). In every fhl1b-depleted embryo, lateral 2 cells contributed to the pancreatic endocrine cells (D, F (as fhl1b MO L2), and H), while in control embryos, most of the lateral 2 cells gave rise to the exocrine pancreas, intestine, and liver, but seldom gave rise to the endocrine pancreas (D, E, F (as L2), and H). In control embryos, lateral 1 cells mostly gave rise to pancreatic and intestinal cells, but not to liver cells (D, E, G (as L1), and H), whereas in every fhl1b-overexpressing embryo, lateral 1 cells contributed to the liver (D, G (as HS @ 8s L1), and H). Data in each 3-D column (%) in E-G were obtained by summing the number of embryos that showed incorporation into a given tissue type and normalizing it to the total number of embryos examined in each specific position: M, L1 and L2. Colored rectangles in H highlight the most dominant pattern in fhl1b morphants (red) and fhl1b-overexpressing (blue) embryos. A-C, confocal projection images, ventral views, anterior to the top. Scale bar, 20 µm. |

Decreased Fhl1b activity inhibits liver and exocrine pancreas differentiation. (A and B) Confocal images of Tg(ptf1a:GFP)jh1 control embryos (A) and fhl1b morphants (B), stained for Prox1 (blue) and Islet (red). The expression domain of the Prox1 and Tg(ptf1a:GFP)jh1 was reduced in fhl1b morphants (B) compared to that of control embryos (A). (C and D) Confocal images of Tg(fabp10a:RFP, ela3l:EGFP)gz12 control embryos (C) and fhl1b MO-injected larvae (D) at 96 hpf. The expression domain of the Tg(fabp10a:RFP, ela3l:EGFP)gz12 was reduced both in the liver and exocrine pancreas in fhl1b MO-injected larvae (D) compared to that of control larvae (C). A-D, confocal projection images, ventral views, anterior to the top. Scale bars, 20 µm. |

Forced induction of fhl1b during the gastrulation stage directly or indirectly modulates pdx1 levels for the endocrine and exocrine pancreas development. (A-D) Whole-mount in situ hybridization showing the expression of pdx1 at 18 hpf (A-B) and 48 hpf (C-D), comparing control embryos (A and C) and fhl1b-overexpressing embryos (B and D, heat shock applied at 6 hpf). In embryos induced to overexpress fhl1b at 6 hpf, both high (white asterisks) and low (gray arrows) levels of pdx1 expression were reduced at 18 hpf (B). Consistently, at 48 hpf, pdx1 expression in the principal islet (white dotted circle) and in the developing exocrine pancreas (white bracket) was reduced (D). (E and F) Confocal images of control embryos and embryos induced to overexpress fhl1b at 6 hpf, stained for Insulin (red). The number of insulin cells was reduced in fhl1b-overexpressing embryos (F), compared to that of control embryos (E) at 78 hpf. (G) The expression of Tg(ins:GFP)zf5 (heat shock applied at 6 hpf) was examined at 50 hpf and the percentages of embryos were quantified. The embryos were scored as having a “reduced” expression when the expression of Tg(ins:GFP)zf5 was distinctly (> 25%) smaller than that of the control embryos based upon the calculation using ImageJ. A-D, dorsal views, anterior to the top. E-F, confocal projection images, ventral views, anterior to the top. Scale bars, 20 µm. |

Fhl1b is an essential mediator of Bmp2b signaling directing the liver versus pancreas fate decision. (A-D) Confocal images of control embryos (A), bmp2b-overexpressing embryos (B), fhl1b morphants (C), and bmp2b-overexpressing fhl1b morphants (D) at 72 hpf, stained for Islet (red; expression in the dorsal pancreatic bud is outlined by white dotted circles) and Prox1 (blue). (B) Prox1 expression in the liver was greatly expanded when bmp2b expression was induced at the 8-somite stage, whereas Islet expression in the mesenchymal cells surrounding the HPD system as well as in the pancreatic endocrine cells appeared unaffected. As in fhl1b morphants (C), the majority of bmp2b-overexpressing fhl1b morphants exhibited an enlarged Islet-positive pancreatic endocrine cell population with a reduced number of Prox1-positive cells in the liver (D, 80% (22 out of total 28 embryos analyzed)). A small portion of bmp2b-overexpressing fhl1b morphants restored the developmental defects of the liver and pancreatic endocrine formation (D, 20% (6 out of total 28 embryos analyzed)). (E-L) Whole-mount in situ hybridization showing the expression of hhex (E-H) and pdx1 (I-L), comparing control embryos (E and I), id2a morphants (F and J), fhl1b morphants (G and K), and double fhl1b/id2a morphants (H and L) at 30 hpf. hhex is expressed in the liver (black arrows) and the dorsal pancreatic bud (white dotted circles). pdx1 is expressed in the developing pancreas including the dorsal pancreatic bud (white dotted circles) and intestine (black brackets), but not in the liver. The hhex expression domain was reduced in the liver of id2a morphants (F, black arrow) but appeared unaffected in the dorsal pancreatic bud (F, white dotted circle). fhl1b morphants showed a reduced hhex expression domain in the liver (G, black arrow) with a concomitant expansion of its expression domain in the dorsal pancreatic bud (G, white dotted circle). Double fhl1b/id2a morphants showed a more severe reduction of hhex expression domain in the liver (H, black arrow), whereas its expression domain in the dorsal pancreatic bud was comparable to that in single fhl1b morphants (compare G and H, white dotted circles). pdx1 expression in id2a morphants was comparable to that in control embryos (J). pdx1 expression domain in double fhl1b/id2a morphants in the dorsal pancreatic bud was expanded (L, white dotted circle), whereas its expression in the intestinal bulb primordium appeared to be reduced (L, black bracket), and was comparable to that in fhl1b morphants (K, white dotted circle and black bracket, respectively). (M-N) Whole-mount in situ hybridization showing the expression of id2a. The expression of id2a in the liver biliary epithelial cells of fhl1b morphants (N) was comparable to that in control embryos (M) at 72 hpf. (O) Schematic model of the relationship between Bmp2b, Fhl1b, and Id2a in liver versus pancreas fate decision. Fhl1b is essentially required for suppressing pdx1 expression to keep progenitors competent to differentiate into the liver, while Id2a is required primarily for liver development. Solid lines indicate connections supported by the data previously reported and presented in this study, while dashed lines indicate potential connections by an unknown Bmp2b effector. A-D, confocal projection images, ventral views, anterior to the top. E-N, dorsal views, anterior to the left (n = 20 per each condition). Scale bars, 20 µm. EXPRESSION / LABELING:
PHENOTYPE:
|
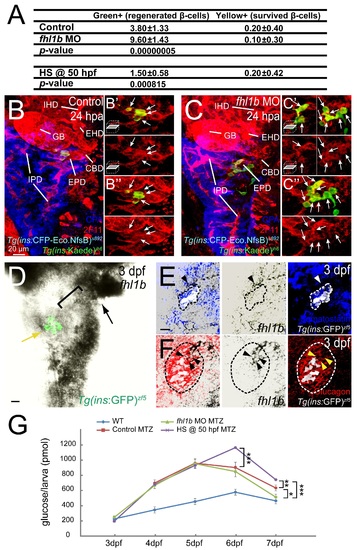
Fhl1b regulates the capacity of β-cell regeneration. (A) Quantification of the number (mean±SD) of regenerated (Green+) and survived β-cells (Yellow+; co-expressing green and red) in control, fhl1b MO-injected, and fhl1b-overexpressing (HS @ 50 hpf) larvae at 36 hours-post-ablation (hpa). Cells in 20 planes of confocal images from 10 individual larvae were counted. (B-C) Confocal images of [Tg(ins:CFP-NTR)s892; Tg(ins:Kaede)jh6] control (B-B′′) and fhl1b MO-injected (C-C′′) larvae at 24 hpa stained with 2F11 (red) and Carboxypeptidase (blue). A greater number of regenerated β-cells in fhl1b-MO injected larvae were mainly located at the junction between the pancreas and the HPD system, specifically at the EPD (C-C′′). While upper insets in B′, B′′, C′, and C′′ show the enlarged images of EPD with white arrows pointing the regenerated β-cells, lower insets in B′, B′′, C′, and C′′ only display the magnified images of EPD with white arrows. Abbreviations: GB, gallbladder; CBD, common bile duct; EHD, extrahepatic duct; EPD, extrapancreatic duct; IHD, intrahepatic duct; IPD, intrapancreatic duct. n = 10 per condition. (D) Double antibody and in situ hybridization staining of fhl1b at 3 dpf in Tg(ins:GFP)zf5 embryos. At 3 dpf, the level of fhl1b expression is high in the liver (black arrow) and in the distal intestine, low in the HPD system (black bracket), and absent in most pancreatic cells except for a few cells in the principal islet (yellow arrow). In the principal islet, fhl1b expression is confined to the peripheral boundary and does not significantly overlap with the core β-cells marked by Tg(ins:GFP)zf5 expression. n = 10. (E-F) Double antibody and in situ hybridization staining of fhl1b with Somatostatin (E) and Glucagon (F) at 3 dpf in Tg(ins:GFP)zf5 embryos. In the principal islet, fhl1b expression (black arrowheads in E and F) does not overlap with the Somatostatin-expressing δ-cells (E) but partially with a small number of Glucagon-expressing α-cells (F). Tg(ins:GFP)zf5 expression is pseudo colored as white, whereas Somatostatin (E) and Glucagon (F) expression is outlined by both white and black dotted circles. The relative position of fhl1b-expressing cells to the Somatostatin (E) and Glucagon (F) expression are indicated by white (E) and yellow (F) arrowheads. Merged views of the middle and right panels are shown in the left panels. n = 10 per condition. (G) Free-glucose levels were measured during β-cell regeneration in wild-type, MTZ-treated, MTZ/fhl1b MO-injected, and MTZ/fhl1b-overexpressing embryos/larvae. At 7 dpf, free-glucose levels were significantly lower in MTZ/fhl1b MO-injected larvae (green line, 512 pmol/larva) than MTZ-treated (red line, 633 pmol/larva) or MTZ/fhl1b-overexpressing (purple line, 742 pmol/larva) larvae. *, P < 0.05; **, P < 0.01; ***, P < 0.001. n = 30 larvae (3 pools of 10 larvae) per data point. B, B′′ and C, C′′, confocal projection images. B′ and C′, confocal single-plane images. D-F, confocal single-plane in situ hybridization images combined with the projection images of Tg(ins:GFP)zf5 (D), Somatostatin (E), and Glucagon (F) expression. Ventral views, anterior to the top. Scale bars, 20 µm. |
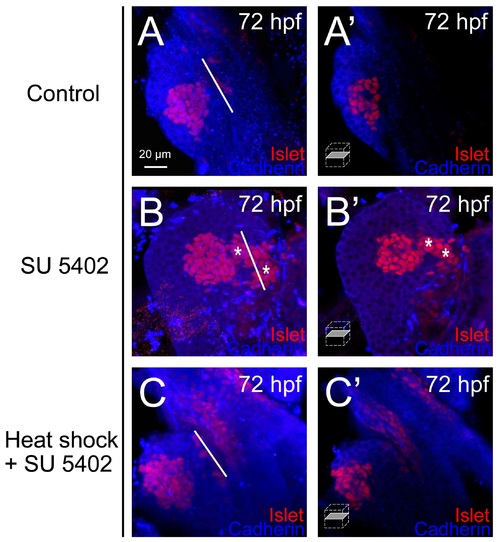
Fhl1b blocks induction of late-forming ventral bud-derived endocrine cells. (A-C′) Confocal images of control embryos without SU5402 (A and A′) and with SU5402 (B and B′) treatment as well as fhl1b-overexpressing embryos with SU5402 treatment (C and C′, heat shock applied at 50 hpf) at 72 hpf, stained for Islet (red) and Cadherin (blue). Upon treatment of Fgf receptor inhibitor SU5402, ectopic Islet-positive endocrine cells appeared in the hepatopancreatic ductal system (HPD) (B and B′, white asterisks). This effect was blocked by overexpression of fhl1b (C and C′). The white lines depict the junction between the pancreas and the HPD. A-C, confocal projection images. A′-C′, confocal single-plane images. Ventral views, anterior to the top. Scale bar, 20 µm. |