
- Title
-
Semaphorin-PlexinD1 Signaling Limits Angiogenic Potential via the VEGF Decoy Receptor sFlt1
- Authors
- Zygmunt, T., Gay, C.M., Blondelle, J., Singh, M.K., Flaherty, K.M., Means, P.C., Herwig, L., Krudewig, A., Belting, H.G., Affolter, M., Epstein, J.A., and Torres-Vazquez, J.
- Source
- Full text @ Dev. Cell
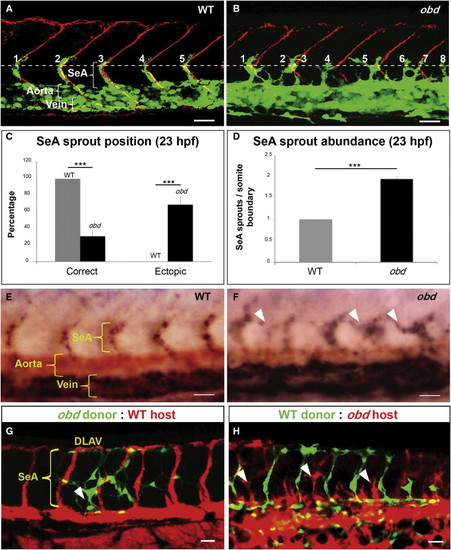
Sema-PlxnD1 Signaling Is Cell Autonomously Required within the Endothelium for Proper SeA Sprout Abundance and Distribution (A and B) 23 hpf vasculatures, green. SBs, red. Horizontal myoseptum (HM), white dotted line. SeA sprouts, numbered. (A) WT. (B) obd. (C and D) SeA sprout position (C) and abundance (D) in 23 hpf WT and obd. n = 8 WT, 12 obd. Error bars represent SEM. ***p < 0.001. (E and F) WISH, 28 hpf trunks. Ectopic SeA sprouts, white arrowheads. Riboprobes: flt4 (blue), cdh5 (red). WT (E). obd (F). n = 10/10 WT, 10/10 obd. (G and H) 32 hpf chimeric vasculatures with ECs of donor (green) and host (red) origin. Examples of ectopic SeA sprouts, white arrowheads. (A, B, E?H) Anterior, left; dorsal, up. Scale bars represent 30 μm. See Figure S1. EXPRESSION / LABELING:
PHENOTYPE:
|
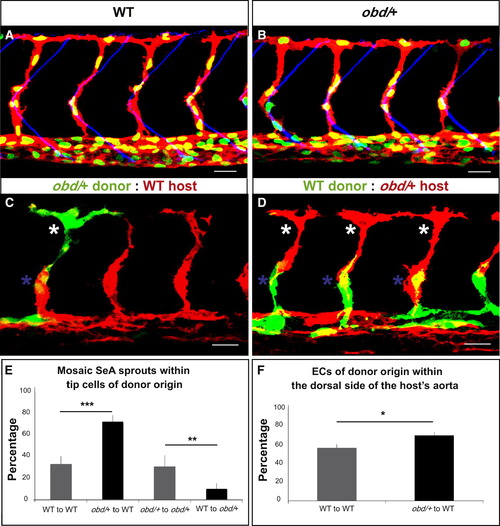
ECs with Less Sema-PlxnD1 Signaling Tend to Become Tip Cells and Occupy the Aorta′s Dorsal Side (A and B) 32 hpf vasculatures. EC nuclei (green), membranes (red). SBs, blue. (A) WT. (B) obd/+. (C and D) 28 hpf vasculatures with ECs of donor (green) and host (red) origin. Asterisks: Tip cells (white), stalk cells (blue). (E) Percentage of mosaic SeAs with tip cells of donor origin in homogenotypic (gray bars) and heterogenotypic (black bars) chimeras. n = 27 WT to obd/+, n = 18 obd/+ to obd/+, n = 38 obd/+ to WT, n = 34 WT to WT. Error bars represent SEM. (F) Percentage of ECs of donor origin found within the dorsal side of the host′s arterial tree in homogenotypic (gray bar) and heterogenotypic (black bar) chimeras. (E and F) *p < 0.05, **p < 0.01, ***p < 0.001. Error bars represent SEM. n = 24 WT to WT, n = 32 obd/+ to WT. (A?D) Anterior, left; dorsal, up. Scale bars represent 30 μm. See Figure S2 and Movie S1. |
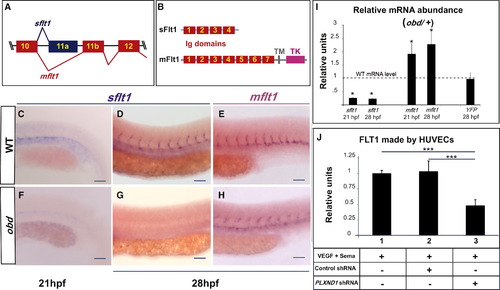
Sema-PlxnD1 Signaling Ensures the Proper Endothelial Abundance of sflt1 (A) Alternative flt1 splicing yields sflt1 and mflt1 isoforms with unique eleventh exons. Exons, colored boxes. Introns, black lines. (B) sflt1 encodes a soluble 474 aa protein. mflt1 encodes a 1,273 aa transmembrane protein. Protein domains: Immunoglobulin (Ig, red numbered boxes), transmembrane (TM, gray box), tyrosine kinase (TK, pink box). (C?H) WISH, embryo trunks (genotypes and ages indicated) hybridized with sflt1 (C and D, F and G) and mflt1 (E and H) riboprobes (blue). (I) qPCR measurements. Relative mRNA abundance of sflt1, mflt1, and YFP (from Tg(flt1:YFP)hu4624/+) in 28 hpf obd/+ (WT level = 1, dashed line). Error bars represent coefficient of variance *p < 0.05. (J) ELISA-based quantification of FLT1 prepared from cell extracts of HUVECs treated with both VEGF and Sema3E and the control or PLXND1-targeting shRNAs. Error bars represent SEM. ***p < 0.001. (C?H) n = 10 embryos per riboprobe, stage and genotype. Pictures of representative examples of stainings observed (10/10 embryos in each category). Anterior, left; dorsal, up. Scale bars represent 50 μm. See Figure S3. EXPRESSION / LABELING:
|
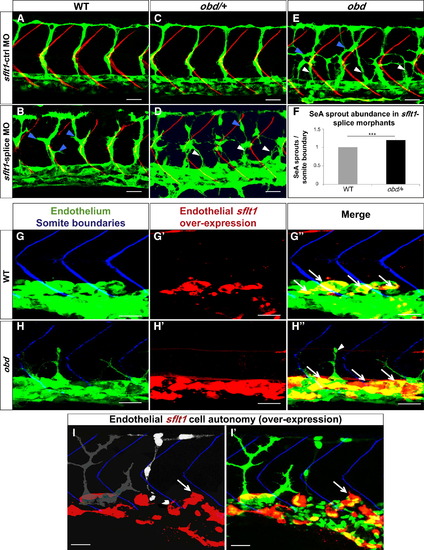
plxnD1 and sflt1 Interact Genetically, sflt1 Limits SeA Angiogenesis Cell Autonomously (A?I) Thirty-two hpf trunk vasculatures, green. (A?E) SBs, red. White arrowheads, ectopic SeA sprouts. Blue arrowheads, ectopic SeA branching. (A, C, E) Embryos treated with 20 ng of sflt1-ctrl MO: WT (A), obd/+ (C), obd (E). Embryos treated with 20 ng of sflt1-splice MO: WT (B), obd/+ (D). (F) 23 hpf SeA sprout abundance in WT (left, gray bar) and obd/+ (right, black bar) sflt1-splice morphants. n = 20 WT and n = 19 obd/+. Error bars represent SEM. ***p < 0.001. (G?I2) SBs, blue. GAL4FF/UAS-mediated endothelial-specific sflt1 overexpression, red. White arrows, missing SeA sprouts. (G2?H3) Endothelial sflt1 overexpression inhibits SeA sprouting. WT (G?G3). obd (H and H3), note lack of sflt1 overexpression (red) in remaining SeA sprout (white arrowhead). (I and I2) Mosaic vasculature with ECs from both obd donor and WT host. Endothelial-specific and mosaic sflt1 and DsRed coexpression restricted to the WT endothelium (red, I and I2). obd ECs express cytosolically targeted EGFP (gray in I; green in I2). WT ECs express nuclear-targeted EGFP (white in I; green in I2). obd and WT ECs without sflt1 overexpression (DsRed-) from SeA sprouts even next to sflt1 overexpressing WT ECs (DsRed+). WT ECs overexpressing sflt1 (DsRed+) fail to form SeA sprouts (white arrows, I and I2). (G?H3) n = 30 embryos with overexpression per genotype, all showing suppression of SeA sprouting. Anterior, left; dorsal, up. Scale bars represent 30 μm. PHENOTYPE:
|
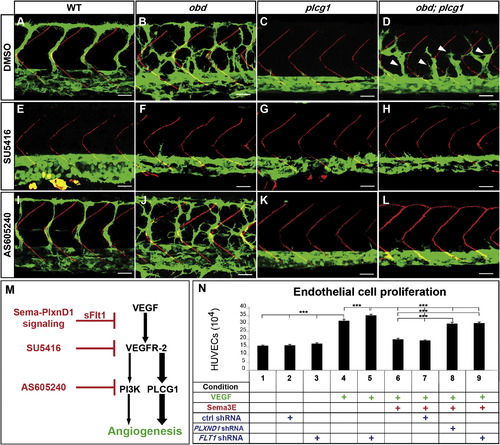
Enhanced VEGF Signaling Causes obd′s Exacerbated SeA Angiogenesis (A?L) Thirty-two hpf trunk vasculatures. WT, obd, plcg1 and obd; plcg1 treated with DMSO, SU5416 (VEGFR inhibitor), or AS605240 (PI3K inhibitor). Genotypes, top; treatments, left. Endothelium, green. SBs, red. White arrowheads, recovered SeA sprouts in obd; plcg1. Anterior, left; dorsal, up. Scale bars represent 30 μm. n = 18 embryos per genotype and treatment. Pictures show representative phenotypes (18/18 embryos per category). (M) Diagram of the VEGF cascade and steps inhibited by sflt1 and drugs used in (E)?(L). (N) HUVEC proliferation in response to combinations of VEGF, Sema3E, and shRNAs (control, PLXND1 and FLT1). ***p < 0.001. Error bars represent SEM. PHENOTYPE:
|
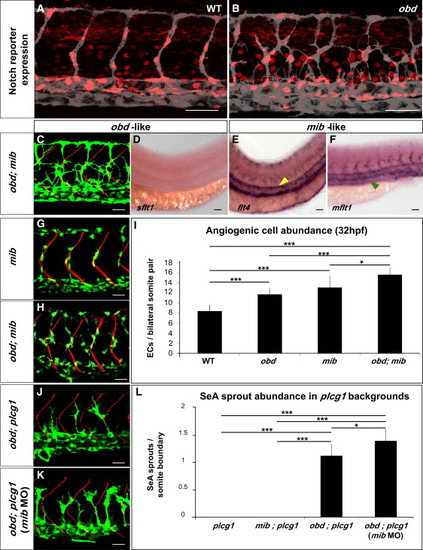
Notch Signaling Loss Does Not Phenocopy obd (A and B) Expression of Notch′s activity nuclear reporter Tg(Tp1bglob:hmgb1-mCherry)jh11 (red) in the endothelium (gray) of WT (A) and obd (B). (C?F) obd; mib. (C) Endothelium, green. SBs, red. (D?F) WISH with sflt1, flt4 and mflt1 riboprobes, as indicated. Double mutant phenotypes classed as obd-like (C and D) or mib-like (E and F) based on the mutant they resemble most. Note lack of sflt (as in Figure 3G) and ectopic aortic flt4 (yellow arrowhead; as in Figure S6A) and venous mflt1 stainings (green arrowhead, as in Figure S6B). (G?I) Angiogenic cell abundance within the trunk′s arterial tree of WT, obd, mib (G) and obd; mib (H) in Tg(fli1:nEGFP)y7 embryos. (G?H) EC nuclei, green. SBs, red. (I) Quantification; n = 10 per genotype. (J?L) SeA sprout abundance in plcg, mib; plcg, obd; plcg (J) and obd; plcg embryos injected with 10 ng of mib MO (mib MO) (K). (J and K) Endothelium, green. SBs, red. (L) n = 8, 7, 11 and 9 for plcg, mib; plcg, obd; plcg and obd; plcg (mib MO), respectively. Scale bars represent 50 μm (A, B, and D?F), 30 μm (C, G, H, J, and K). (I and L) *p < 0.05, ***p < 0.001. Error bars represent SEM. (A?F, G, H, J, and K) Anterior, left; dorsal, up. Trunk images and quantifications: 32 hpf (A?C, G?L), 28 hpf (D?F). |
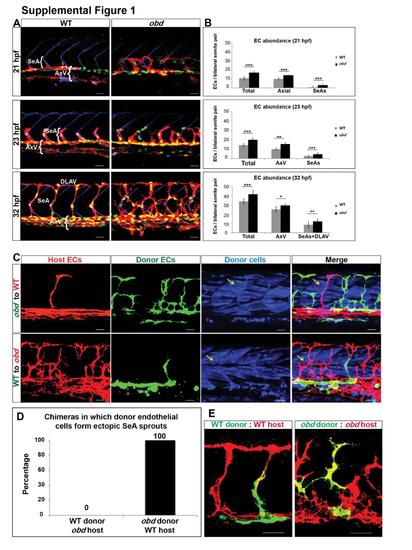
Related to Figure 1. Sema-PlxnD1 signaling limits the abundance of arterial angiogenic cells and axial vasculature ECs and is cell-autonomously required in the endothelium. (A-B) obd have too many ECs in SeA sprouts/DLAVs and in the axial vasculature. Abbreviations: Segmental Artery sprouts (SeAs), Axial vessels (AxV), Dorsal Longitudinal Anastomotic Vessel (DLAV). (A) 21, 23 and 32 hpf trunk vasculatures of WT and obd. EC nuclei, green. EC membranes, red. Somite boundaries, blue. (B) Quantification of EC abundance in WT and obd at 21, 23 and 32 hpf. n=at least 6 embryos per stage per genotype. *p < 0.05, **p < 0.01, ***p < 0.001. Error bars, s.e.m. (C) plxnD1 is required cell autonomously in the endothelium. 32 hpf chimeric trunk vasculatures. Top row, chimera made using an obd donor and a WT host. Bottom row, chimera made using a WT donor and an obd host. ECs of host origin, red. ECs of donor origin, green. Lineage tracer-labeled donor cells, blue. Yellow arrows, examples of somitic muscle fibers of donor origin. (D) Quantification of the frequency with which ECs cells of donor origin form ectopic SeA sprouts in WT-to-obd and obd-to-WT chimeras (n=42 obd to WT, n=56 WT to obd) (E) SeA sprouts are not necessarily of clonal origin. Mosaic SeA sprouts in WT (left) and obd (right) homogenotypic 32 hpf chimeras. Donor ECs, green. Host ECs, red. (A, C, E) Anterior, left; dorsal, up. Scale bars, 30 μm. |
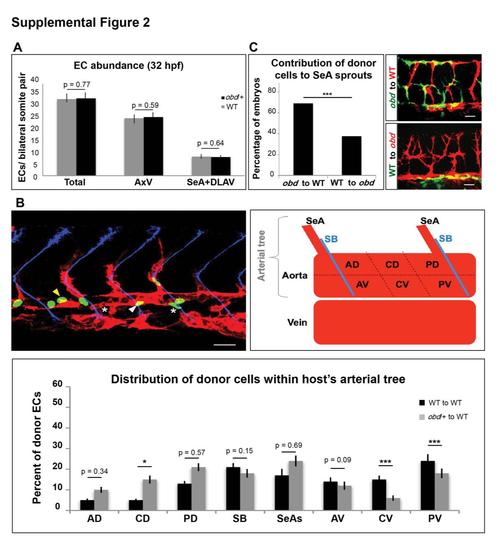
Related to Figure 2. obd/+ and WT Embryos Have Identical EC Abundances, but ECs of These Genotypes Distribute Differently within the Trunk Vasculature of WT Hosts (A) Quantification of EC abundance at 32 hpf in WT (grey bars) and obd/+ (black bars). Abbreviations: Segmental arteries (SeAs), Axial vessels (AxV), Dorsal Longitudinal Anastomotic Vessels (DLAVs). n = 11 WT, n = 13 obd/+. Error bars, s.e.m. (B) Left, example of the trunk vasculature of a 21-23 hpf chimera made using a WT donor and an obd/+ host. ECs by origin: donor (green nuclei), host (red). Somite boundaries, blue. EC nuclei of donor origin found within the host?s aorta abbuting the somite boundary (white arrowhead) or within the central dorsal (CD) region of this vessel (yellow arrowhead) are indicated. White asterisk marks ECs presumably migrating ventrally towards the vein. Top right, diagram of the 21-23 hpf trunkvasculature (red). Somite boundaries (SB), blue. Arterial tree: SeAs and aorta. Aorta subdivided into anterior dorsal (AD), central dorsal (CD), posterior dorsal (PD), somite boundary-abutting (SB), anterior ventral (AV), central ventral (CV) and posterior ventral (PV) regions. Bottom, distribution of ECs of donor origin within the arterial tree of both kinds of WT:obd/+ chimeras. n = 27 each. *p < 0.05, ***p < 0.001. Error bars, s.e.m. (C) Quantification, along with representative images, of the frequency with which donor cells contribute to SeA sprouts in obd-to-WT and WT-to-obd transplants. n = 60 for WT-to-obd, n = 65 for obd-to-WT. (C-D) Confocal images and diagram: Anterior, left; dorsal, up. Scale bars 30 μm. |
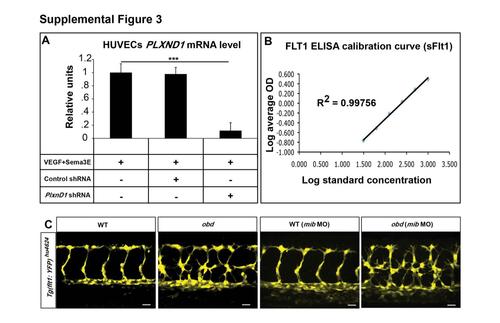
Related to Figure 3. PLXND1 mRNA Levels in HUVECs under Different Conditions, Experimental Controls for Flt1 ELISA and Expression of the flt1 Transcriptional Reporter Tg(flt1:YFP)hu4624 in WT and obd (A) Validation of shRNA-mediated PLXND1 knockdown. qPCR measurements of PLXND1 mRNA abundance in HUVECs treated with VEGF and Sema3E and infected with the indicated control or PLXND1-targeting shRNA lentiviral particles. ***p < 0.001. Error bars, s.e.m. (B) Standard calibration curve generated for the ELISA-based quantification of Flt1 made by HUVECs based on average optical density (OD) at various concentrations. Coefficient of determination, R2 = 0.99756. Error bars, s.e.m. (C) Expression of the Tg(flt1:YFP)hu4624 reporter in WT and obd with or without 10 ng of mib morpholino (mib MO). n = 10 for WT, n = 12 for obd, n = 11 for WT (mib MO) and n = 9 for obd (mib MO). |
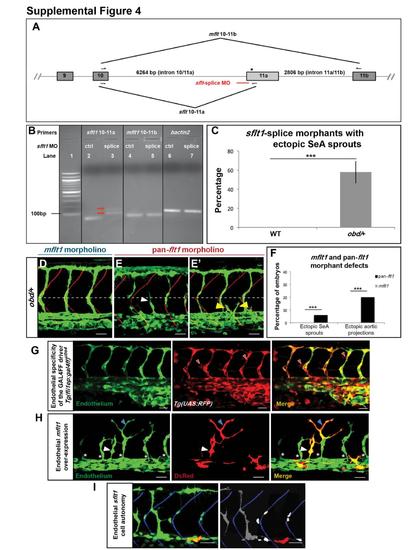
Related to Figure 4. Validation of sflt1-Splice Morpholino (MO), Quantification of the Vascular Effects of Different flt1 Morpholinos, Validation of the GAL4FF Driver Line Tg(fliep:gal4ff)ubs4 and Vascular Effects of the Endothelial-Specific Over-Expression of flt1 Isoforms (A) Diagram of flt1′s pre-mRNA (only exons 9-11b shown, not drawn to scale). Exons, boxes. Introns, grey lines. Hemiarrows, mflt1 and sflt1 primers. Red line, sflt1-splice MO. Asterisk, stop codon (exon 11a′s bp 19-21). (B) Validation of the sflt1-splice MO, DNA electrophoresis gel. Lane 1, 100 bp DNA ladder. Lanes 2-7, RT-PCR products obtained from embryos treated with 25 ng of sflt1-ctrl (lanes 2, 4, 6) or sflt1-splice MOs (lanes 3, 5, 7). The correctly spliced sflt1 RT-PCR product (85 bp) seen in sflt1-ctrl morphants (lane 2) is absent from sflt1-splice morphants (lane 3), which show two products larger (red arrows) than those seen in correctly spliced sflt1. Hence, the sflt1-splice MO appears to block the canonical splice site at the intron 10/11a-exon 11a junction, forcing the use of a cryptic splice site (Morcos, 2007). mflt1 and bactin2 are unaffected by either sflt1 MO (lanes 4-7). (C) Percentage of WT (left) and obd/+ (right, grey bar) sflt1-splice morphants with ectopic SeA sprouting. n = 20 WT and n = 19 obd/+. (D-E′) Endothelium, green. Somite boundaries, red. Horizontal myoseptum, white dotted line. White arrowhead, ectopic SeA sprouts. Yellow arrowheads, ectopic aortic projections. Characteristic defects induced by treating obd/+ with 10 ng of mflt1 (D) or previously validated pan-flt1 (E-E′) morpholinos. Scale bars, 50 μm. (F) Quantification of the vascular defects of mflt1 and pan-flt1 obd/+ morphants, including ectopic SeA sprouts (as in E) and ectopic aortic projections (as in E′). n = 30 for both morpholinos. ***p < 0.001. Error bars, s.e.m. (G) Tg(fliep:gal4ff)ubs4 drives endothelial-specific expression of the responder Tg(UAS:RFP) line. 32 hpf trunk vasculature of a Tg(fli:EGFP)y1/+; Tg(fliep:gal4ff)ubs4/+; Tg(UAS:RFP)/+ embryo. Endothelium, green (EGFP). GAL4FF/UAS mediated RFP expression (red). Red filled arrowheads, examples of ectopic, non-endothelial RFP expression. (H) Tg(fliep:gal4ff)ubs4-mediated EC-specific mosaic mFlt1 over-expression can induce ectopic and mispatterned SeA sprouts in WT embryos. 32 hpf trunk vasculature (green) with EC-specific co-expression of mFlt1 and DsRed (red). White arrowheads, ectopic DsRed+ SeA sprout over-expressing mFlt1. Blue arrowheads, misshapen EC over-expressing mFlt1 found within a properly positioned SeA. White asterisks, properly positioned SeA sprouts without mFlt1 over-expression. (I) sflt1 acts cell autonomously within the endothelium. Trunk vasculature (green) of a chimeric 32 hpf embryo made by transplanting obd cells from a Tg(fli:EGFP)y1/+; Tg(fliep:gal4ff)ubs4/+ donor with mosaic, endothelial-specific GAL4FF-dependent co-expression of sflt1 and DsRed (red) into a WT Tg(flk1:EGFP-NLS)/+ host. obd donor ECs (cytosolic green, left) over-expressing sflt1 (DsRed+, red) fail to form SeA sprouts. In contrast, obd ECs not over-expressing sflt1 (cytosolic green, left; grey, right) and WT ECs (nuclear green, left; white, right ? only the nuclei of cells within SeA sprouts are shown) form SeA sprouts even when adjacent to obd ECs over-expressing sflt1 (red). Somite boundaries, blue. (G-I) Scale bars, 30 μm. Anterior, left; dorsal, up. PHENOTYPE:
|
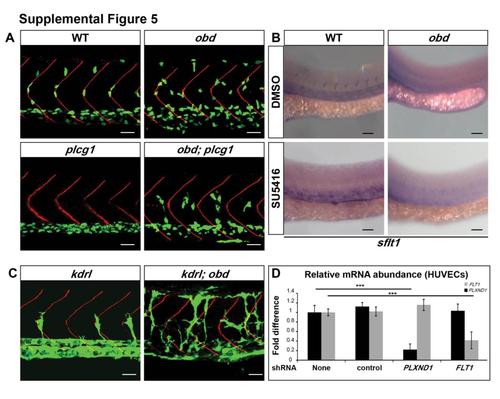
Related to Figure 5. Interactions between Sema-PlxnD1 and VEGF Pathway Mutants, Effects of SU5416 on sflt1 Expression and Validation of shRNA-Mediated Knockdown of PLXND1 and FLT1 in HUVECs (A) Cellularized SeA sprouts in WT, obd and obd; plcg1. 32 hpf trunk vasculatures. EC nuclei, green. Somite boundaries, red. Genotypes indicated on top. (B) SU5416 mediated inhibition of VEGF signaling does not visibly affect sflt1 levels in either WT or obd. 28 hpf trunks of embryos subjected to WISH with sflt1 riboprobe (blue) after treatment starting at 20 hpf with 0.025% DMSO (vehicle control) or 0.5 μM SU5416 (in 0.025% DMSO). (C) SeA phenotype of kdrl and obd; kdrl double mutants at 32 hpf. (D) Quantification of PLXND1 and FLT1 mRNA in HUVECs following treatment with control, PLXND1-targeting or FLT1-targeting shRNAs. (E) *p < .05, ***p < 0.001. Error bars: s.e.m. (C) n = 8 for kdrl, n = 8 for obd; kdrl. (A, B, C) Anterior, left; dorsal, up. Scale bars, 30 μm (A and C); 50μm in (B). |
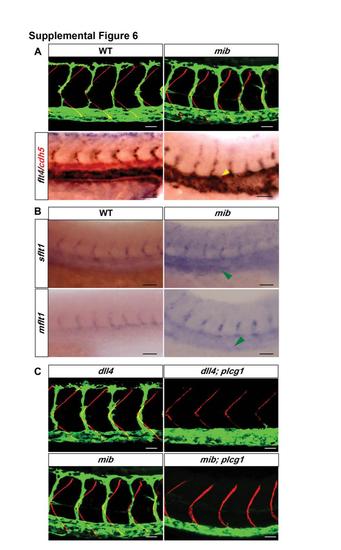
Related to Figure 6. Loss of Notch Signaling Does Not Lead to obd-Like SeA Phenotypes (A) Top row, mib displays proper SeA positioning and abundance. 32 hpf trunk vasculatures of WT and mib embryos. Endothelium, green. Somite boundaries, red. Bottom row, mib displays ectopic flt4 expression within the aorta. 28 hpf trunk vasculatures of WT and mib embryos. Two-color WISH with flt4 (blue) and cdh5 (red) riboprobes. Ectopic flt4 aortic expression (yellow arrowhead). Scale bars, 30 μm. (B) sflt1 and mflt1 levels are not visibly reduced in mib. 28 hpf WT and mib trunks subjected to WISH with sflt1 (upper panel) and mflt1 (lower panel) riboprobes show no visible changes in expression except for enhanced expression of both isoforms in the vein of mib (green arrowheads). Scale bars, 50 μm. (C) Removal of Notch signaling does not rescue the SeA angiogenesis deficit of plcg1 mutants. 32 hpf trunk vasculatures (green) of dll4, dll4; plcg1, mib and mib; plcg1 embryos. Somite boundaries, red. Scale bars, 30 μm. (A-C) Anterior, left; dorsal, up. |

Unillustrated author statements EXPRESSION / LABELING:
|
Reprinted from Developmental Cell, 21(2), Zygmunt, T., Gay, C.M., Blondelle, J., Singh, M.K., Flaherty, K.M., Means, P.C., Herwig, L., Krudewig, A., Belting, H.G., Affolter, M., Epstein, J.A., and Torres-Vazquez, J., Semaphorin-PlexinD1 Signaling Limits Angiogenic Potential via the VEGF Decoy Receptor sFlt1, 301-314, Copyright (2011) with permission from Elsevier. Full text @ Dev. Cell