
|
Fig. S6
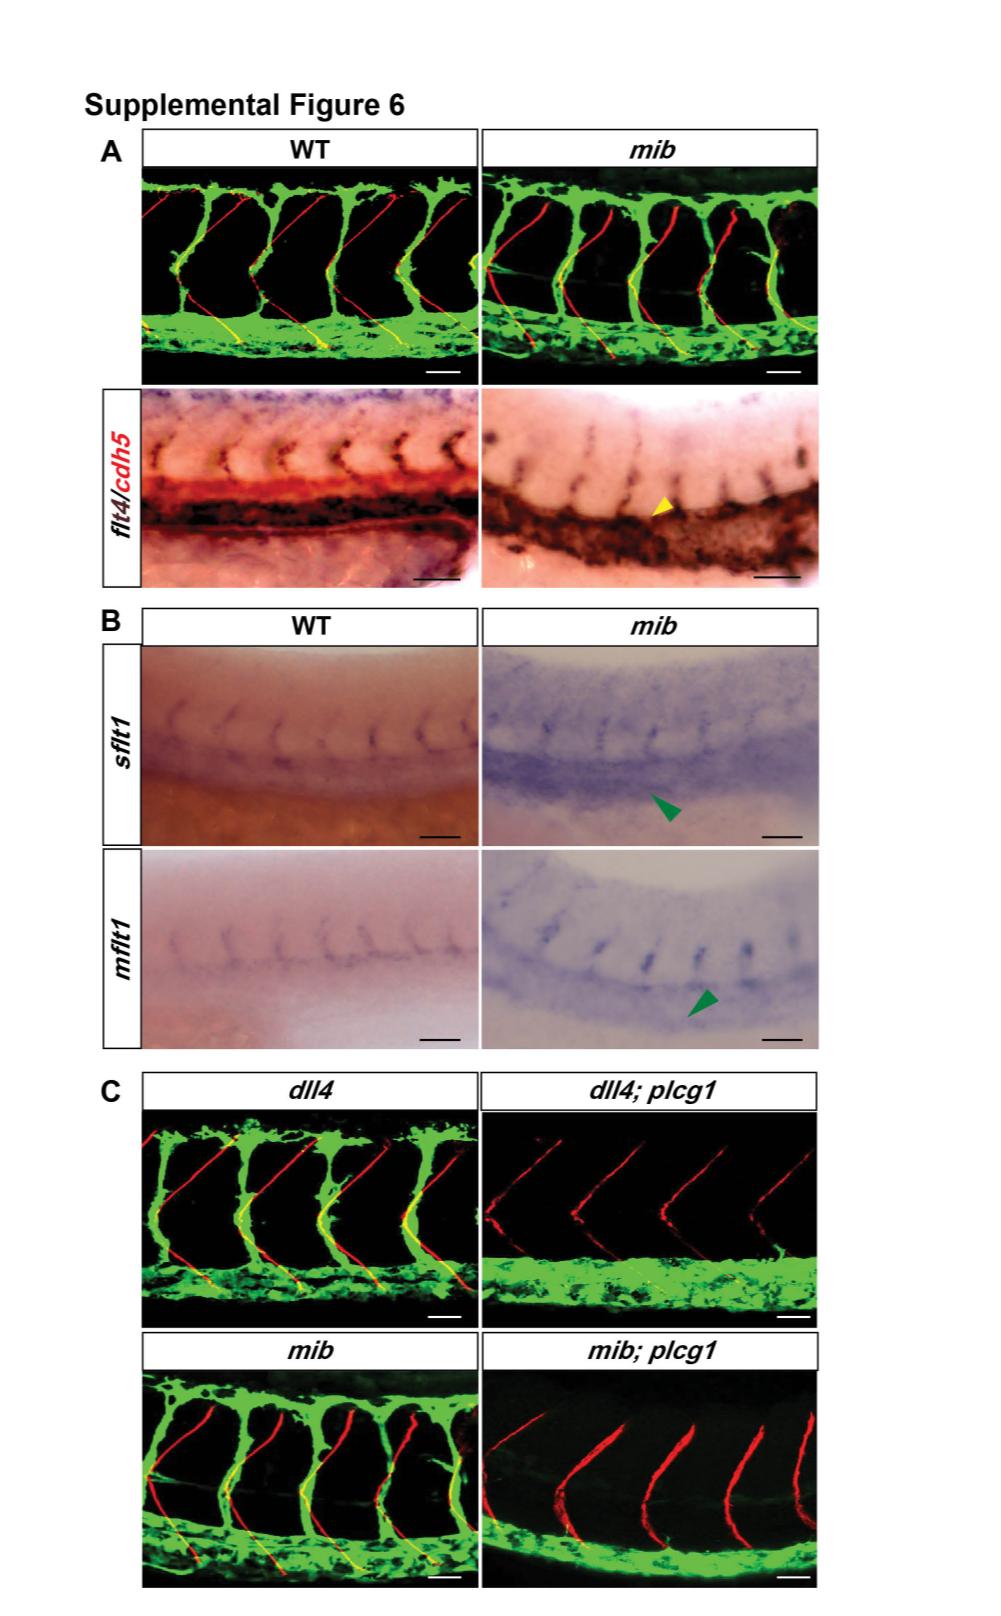
Related to Figure 6. Loss of Notch Signaling Does Not Lead to obd-Like SeA Phenotypes
(A) Top row, mib displays proper SeA positioning and abundance. 32 hpf trunk vasculatures of WT and mib embryos. Endothelium, green. Somite boundaries, red. Bottom row, mib displays ectopic flt4 expression within the aorta. 28 hpf trunk vasculatures of WT and mib embryos. Two-color WISH with flt4 (blue) and cdh5 (red) riboprobes. Ectopic flt4 aortic expression (yellow arrowhead). Scale bars, 30 μm. (B) sflt1 and mflt1 levels are not visibly reduced in mib. 28 hpf WT and mib trunks subjected to WISH with sflt1 (upper panel) and mflt1 (lower panel) riboprobes show no visible changes in expression except for enhanced expression of both isoforms in the vein of mib (green arrowheads). Scale bars, 50 μm. (C) Removal of Notch signaling does not rescue the SeA angiogenesis deficit of plcg1 mutants. 32 hpf trunk vasculatures (green) of dll4, dll4; plcg1, mib and mib; plcg1 embryos. Somite boundaries, red. Scale bars, 30 μm. (A-C) Anterior, left; dorsal, up.
Reprinted from Developmental Cell, 21(2), Zygmunt, T., Gay, C.M., Blondelle, J., Singh, M.K., Flaherty, K.M., Means, P.C., Herwig, L., Krudewig, A., Belting, H.G., Affolter, M., Epstein, J.A., and Torres-Vazquez, J., Semaphorin-PlexinD1 Signaling Limits Angiogenic Potential via the VEGF Decoy Receptor sFlt1, 301-314, Copyright (2011) with permission from Elsevier. Full text @ Dev. Cell