
Fig. 5
|
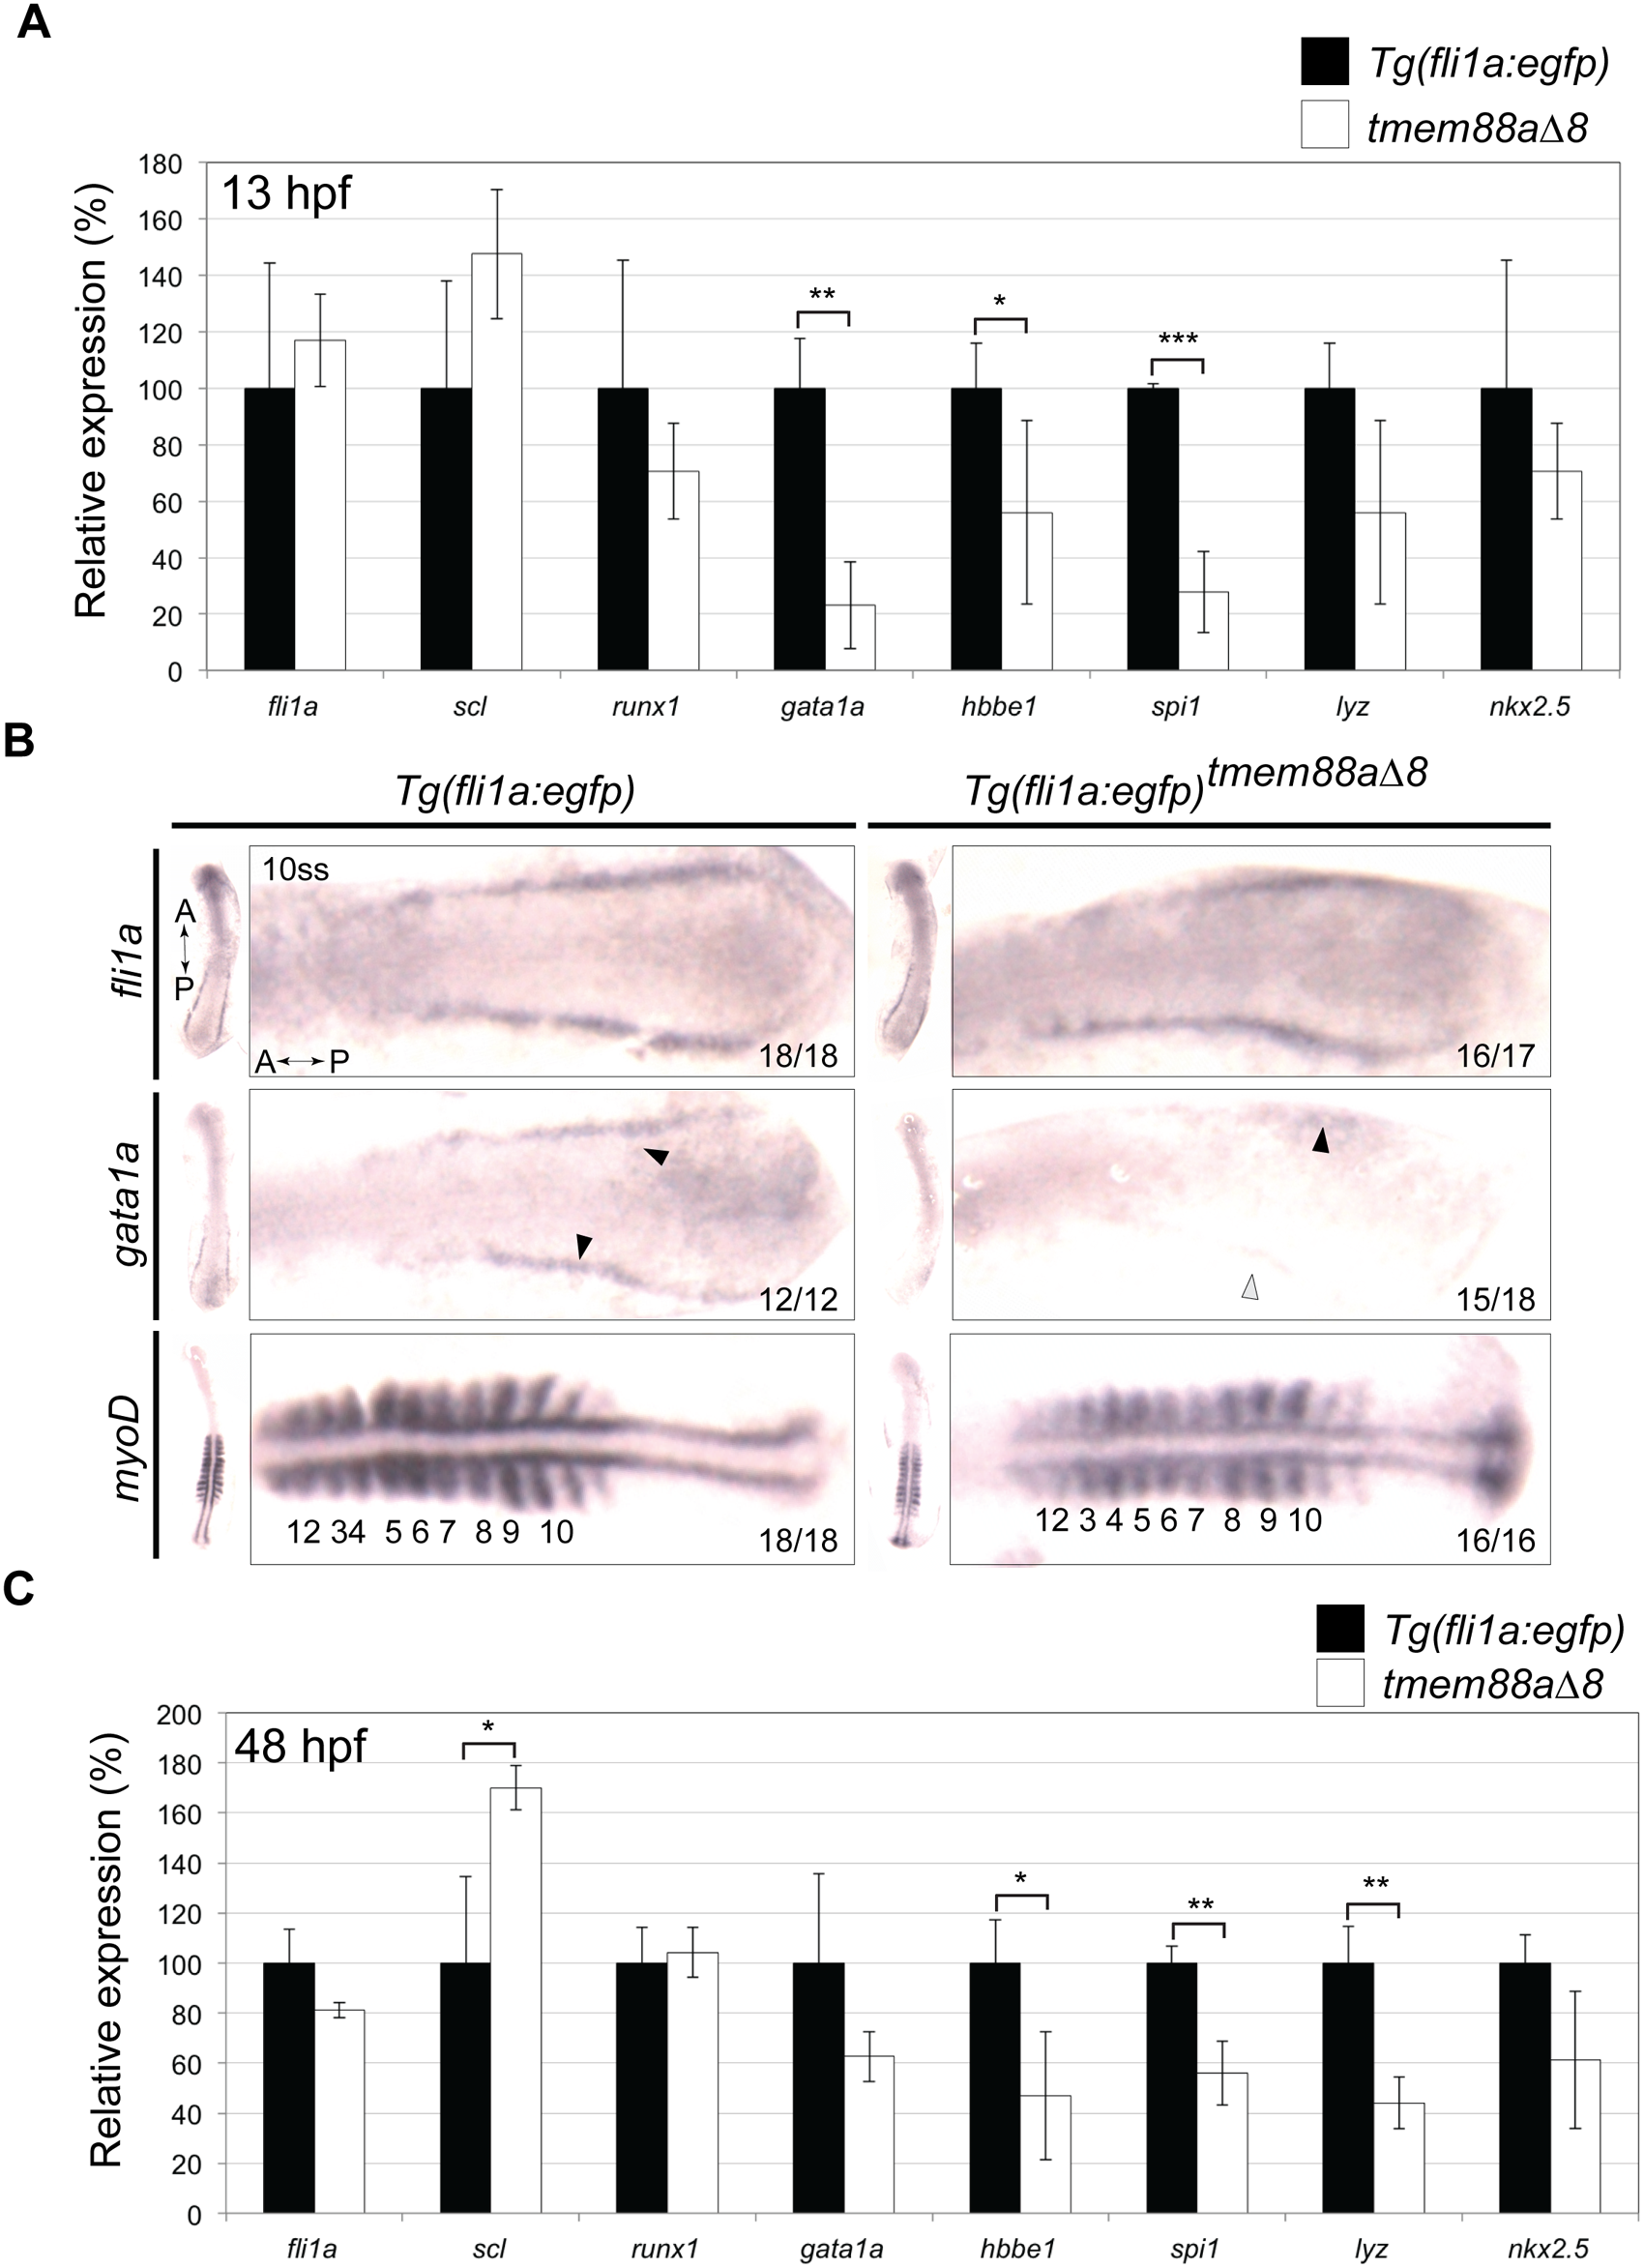
Fig. 5
Cardiovascular associated genes are downregulated in tmem88aΔ8 embryos.
(A) qRT-PCR showing the expression of key cardiovascular genes in tmem88Δ8 mutants compared to Tg(fli1a:egfp) controls at 13 hpf. (B) In situ hybridisation for fli1a, gata1a, and myoD in control and tmem88aΔ8 mutants as labelled. Gata1a expression is denoted with black error heads, reduced or absent expression is shown with grey or white arrowheads respectively. Somites are marked by asterisks. (C) qRT-PCR showing the expression of key cardiovascular genes in tmem88Δ8 mutants compared to Tg(fli1a:egfp) controls at 48 hpf. All P-values determined by Unpaired Student’s t test. Error bars denote the standard deviation of three biological replicates. P-values determined by Unpaired Students t test. * = p<0.05; ** = p<0.01; *** = p<0.001; unlabelled bars show no significant difference (p>0.05). fli1a, friend leukaemia integration 1a; gata1a, GATA-binding factor 1a; hbbe1, haemoglobin beta-embryonic 1; hpf, hours post fertilisation; lyz, lysozyme; runx1, runt-related transcription factor 1; scl, stem cell leukaemia; spi1, spleen focus forming virus (sffv) and proviral integration oncogene 1b (also known as pu.1).