
Fig. 3
|
Fig. 3
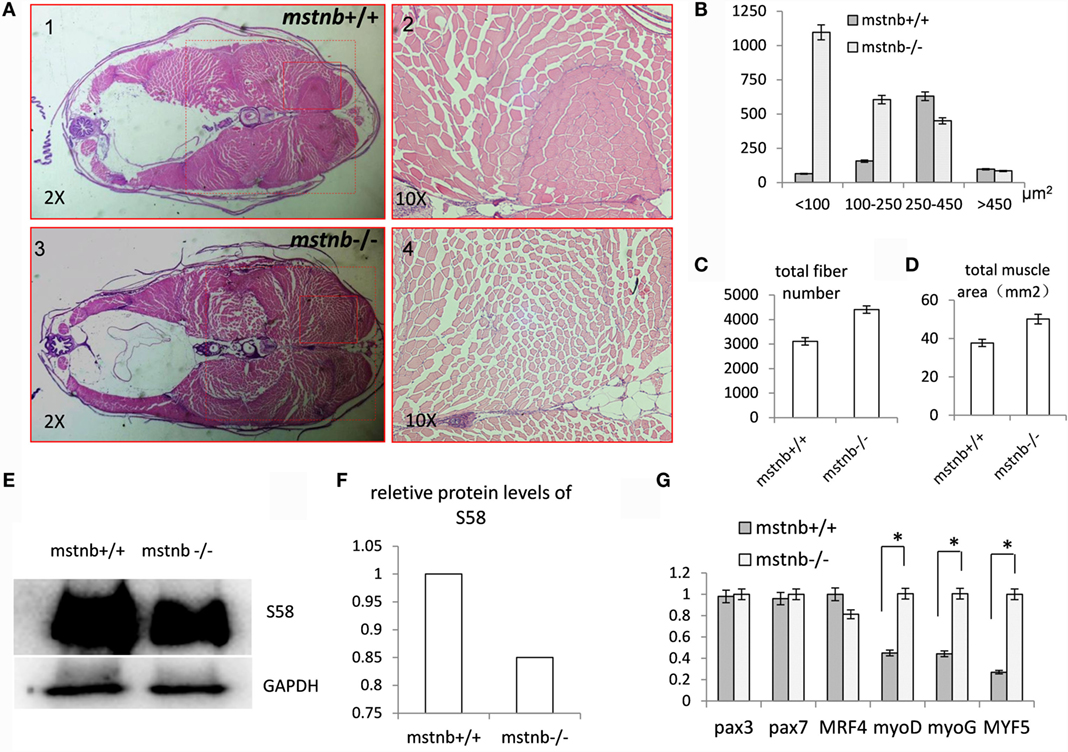
General characterization of the muscle tissues of mstnb-deficient zebrafish. (A) Paraffin section and H&E staining of mstnb-deficient zebrafish (A3, A4) and wild-type control fish (A1, A2). Lower magnification images are shown in A1 and A3; higher magnification of the indicated regions of A1 and A3 are shown in A2 and A4. (B) The distribution of muscle numbers are according to theirs sizes. The Y-axis indicates the numbers of muscle fibers at certain cross areas (μm2) of <100, 100–250, 250–450, and >450. The dotted rectangles in A1 and A3 define the areas for analysis. (C) The total fiber number of mstnb−/− and mstnb+/+ zebrafish sections. (D) The diagram shows the total area of muscle tissue in the body cross-section. (E) Western blot analysis of slow myofiber-specific protein S58 from muscle tissue of mstnb+/+ (left panel) and mstnb−/− (right panel). GAPDH protein was used as an internal control. (F) The western blot analysis was quantified by gray value analysis using Image J software. (G) Transcriptional expression levels of myogenesis genes. * indicate significant differences at (P < 0.05).