
IMAGE
Fig. 7
Image
|
Figure Caption
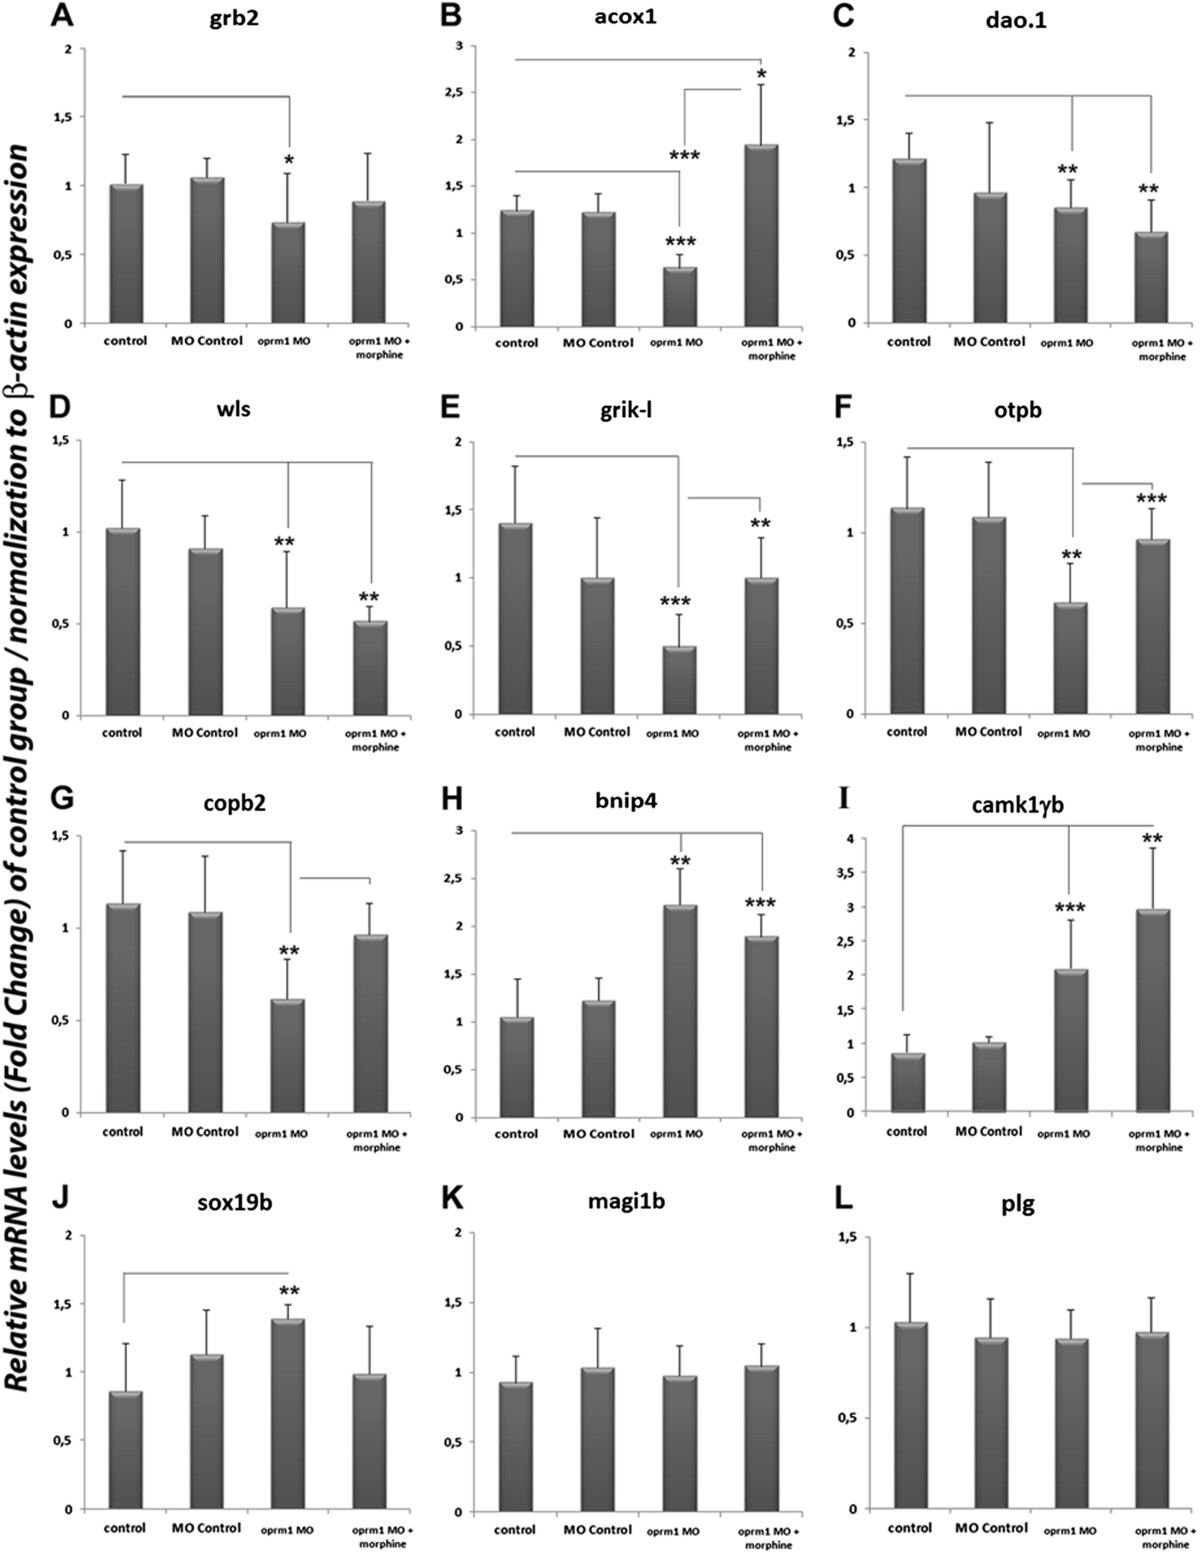
Fig. 7
Knockdown of µ opioid receptor ( oprm1 ). Expression levels of grb2, acox1, dao.1, wls, grik-l, otpb, copb2, bnip4, camk1gb, sox19b, magi1b and plg of the Control group, the Morpholine (MO) control, Morpholine oprm1 (oprm1-MO) and oprm1-MO exposure to morphine (oprm1-MO + morphine). The expression levels were quantified using RT-qPCR analysis and were normalized to β-actin expression. Each bar represents the FC ± SD (n = 8). Data were analyzed by one-way ANOVA and using the Tukey post-hoc test. P values of < 0.05 being considered statistically significant (***p < 0.001; **p < 0.01; *p <0.05).
Figure Data
Acknowledgments
This image is the copyrighted work of the attributed author or publisher, and
ZFIN has permission only to display this image to its users.
Additional permissions should be obtained from the applicable author or publisher of the image.
Full text @ BMC Genomics