|
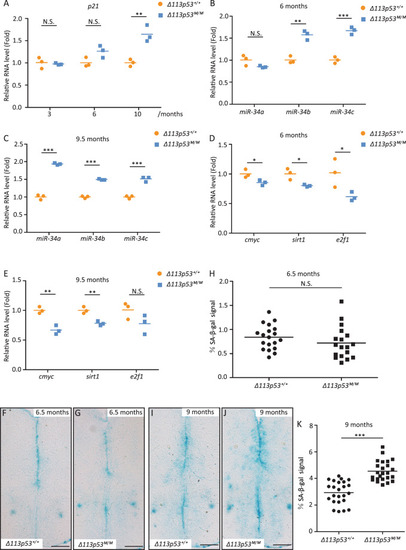
<italic>Δ113p53</italic><sup><italic>M/M</italic></sup> zebrafish telencephalon has increased levels of cell senescence markers.A–E Relative expression of p21(A), cmyc, sirt1, e2f1 mRNAs (D, E), and miR-34a, miR-34b, miR-34c miRNAs (B, C) at different ages in the Δ113p53+/+ and Δ113p53M/M telencephalons, as indicated. The total RNA was extracted from a pool of at least six telencephalons in each group. The average gene expression of mRNAs and miRNAs was normalized against β-actin and U6, respectively. F–K Senescence-associated β-galactosidase (SA-β-gal) staining in the telencephalons of Δ113p53+/+ (F, I) and Δ113p53M/M zebrafish (G, J) at 6.5- and 9-months old as indicated. Scale bar, 100 μm. The average SA-β-gal signal was quantified with Photoshop and presented as the percentage of pixels per unit area of the section measured in the telencephalon (H, K). Each dot represents the average SA-β-gal signal in each section. About three to five sections were taken from the middle region of each telencephalon, and at least four telencephalons were sampled in each group. Statistical analysis was performed on relevant data using the Student’s two-tailed t test. N.S., P > 0.05, *P < 0.05, **P < 0.01, ***P < 0.001.
|