|
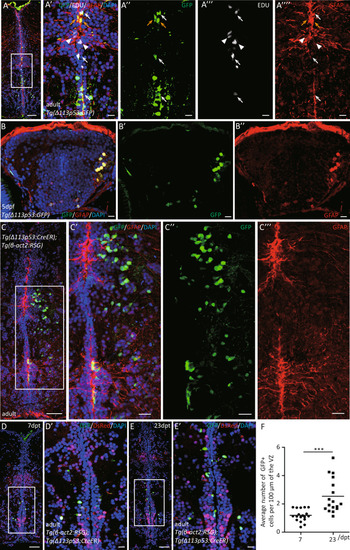
<italic>Δ113p53</italic>-positive radial glia cells undergo cell proliferation and contribute to the neuron renewal process.A Cryosections of EDU-labeled Tg(Δ113p53:GFP) telencephalon were immunostained by anti-GFP (in green), anti-GFAP (in red), labeled-EDU in white, and nuclei with DAPI (in blue). The framed area in A was magnified in A’, anti-GFP in A”, labeled-EDU in A”’ and anti-GFAP in A””. White arrow: GFP+/GFAP+/EDU+ cells. Yellow arrows: GFP+/GFAP+ cells; white arrowhead: EDU+/GFAP+ cells. Scale bar in A, 50 μm; Scale bar in A’, A”, A”’, A””, 10 μm. B Cryosections of Tg(Δ113p53:GFP) larva brain at 5 dpf were immunostained by anti-GFP (in green) (B’) and anti-GFAP (in red) (B”) antibodies. Scale bar, 10 μm. C–FΔ113p53-positive cells in Tg(Δ113p53:CreER;β-act2:RSG) transgenic fish were genetically labeled at 5 dpf or at the adult stage by inducing Cre activity with 4-HT. The labeled larvae grew up to 6-months old and were subjected to immunostaining analysis (C), whereas the labeled adult fish were sampled at either 7 (D) or 23 dpt (E). Cryosections of labeled Tg(Δ113p53:CreER;β-act2:RSG) telencephalon were immunostained by anti-GFP (in green), anti-GFAP (in red) antibodies in C. In D and E, the red fluorescence was from the expression of en vivo DsRed. The nuclei were stained with DAPI (blue). The framed area in C was magnified in C’ (merged), C” (GFP), and C”’ (GFAP). Framed areas in D and E were magnified in D’ and E’, respectively. Scale bar in C, D, E, 50 μm; Scale bar in C’, C”, C”’, 20 μm; Scale bar in E’, F’, 10 μm. The average number of GFP+ radial glia cells per 100 μm along the ventricle zone of Tg(Δ113p53:CreER; β-act2:RSG) telencephalon at 7 and 23 dpt was represented in F. Each dot represents the average number of GFP+ radial glia cells per 100 μm of the ventricular zone (VZ) in one section. The middle region of each telencephalon (about three to six sections) was used for the counting and three telencephalons were sampled in each group. Statistical analysis was performed on relevant data using the Student’s two-tailed t test. ***P < 0.001.
|