
Fig. 7-S1
- ID
- ZDB-FIG-191014-25
- Publication
- Yu et al., 2019 - Stochastic cell-cycle entry and cell-state-dependent fate outputs of injury-reactivated tectal radial glia in zebrafish
- Other Figures
- All Figure Page
- Back to All Figure Page
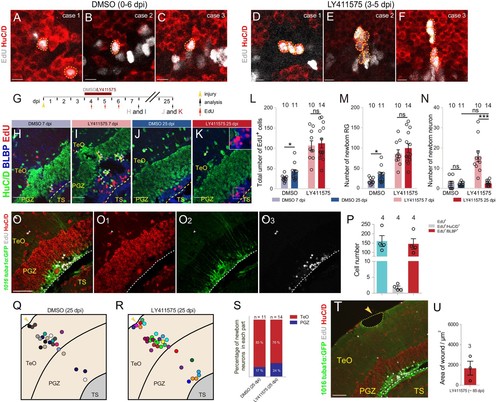
Late Notch inhibition-induced over-produced neurons are short-lived.(A–F) Representative images of EdU (gray) and HuC/D (red) immunofluorescences showing the over-produced neurons in the optic tecta of the fish treated with LY411575 during 4–5 dpi (D–F) always shown as a cell cluster. (A–C) are the representative images of DMSO-treated optic tecta. Yellow dashed circles indicate the newborn neurons. (G) A schematic of the experimental procedure for Notch inhibition experiments shown in (H–K). Fish are injected with EdU for three consecutive days (4–6 dpi) and administrated with LY411575 or DMSO for two consecutive days (4–5 dpi). Fish are analyzed at 7 dpi or 25 dpi. (H–K) Representative images of HuC/D (green), BLBP (blue) and EdU (red) immunofluorescences showing that many newborn neurons (white arrowheads in (I)) are existed in Notch-inhibited (4–5 dpi) optic tectum at 7 dpi, but only a few newborn neurons (white arrowheads in (K)) are still remained at 25 dpi. (H and J) The representative images of DMSO-treated control optic tecta at 7 and 25 dpi, respectively. (L–N) Quantification of EdU+ newborn cells (L), EdU+/BLBP+newborn RG (M), and EdU+/HuC/D+ newborn neuron (N) in (H–K) (≥3 replicates for each group; mean ± SEM,***p<0.001; *p<0.05; ns, p>0.05; Wilcoxon test in (L and M), two-way ANOVA followed by Tukey’s HSD test in (N)). (O–O3) Representative images of Tg(1016tuba1α:GFP) (green), EdU (gray) and HuC/D (red) immunofluorescences showing the remaining neuron (white arrowheads) in the optic tectum of the fish treated with LY411575 during 4–5 dpi can survive up to 86 dpi if it is not eliminated by 25 dpi. (P) Quantification of the EdU+ newborn cells, EdU+/HuC/D+ newborn neurons and EdU+/BLBP+ RG in (O–O3) (mean ± SEM, n = 4). (Q and R) Schematic diagrams of the distribution of newborn neurons in the injured 25-dpi optic tecta of the fish treated with DMSO or LY411575 during 4–5 dpi. Circles in different colors represent the newborn neurons from different individuals. (S) Proportion of the newborn neurons in TeO and PGZ of the optic tectum shown in (Q and R). Most of the neurons are existed in the TeO. (T) Representative images of EdU (gray) and HuC/D (red) immunofluorescences showing Notch inhibition during 4–5 dpi does not help to complete restoration of stab wound of the injured optic tectum. Yellow dashed circle indicate the stab wound. (U) Quantification of the area of stab wounds from the ~85 dpi fish treated with LY411575 during 4–5 dpi (1670 ± 704 μm2; mean ± SEM, n = 3). The numbers above the bars indicate the animals used. Yellow arrow heads indicate the injury sites. White dashed lines represent the tectal ventricle boundary. RG, radial glia; PGZ, periventricular gray zone; TeO, tectal opticum; TS, torus semicircularis. Scale bars, 50 μm (O–O3 and T); 20 μm (H–K); 5 μm (A–F). |