
Fig. 2
- ID
- ZDB-FIG-191014-15
- Publication
- Yu et al., 2019 - Stochastic cell-cycle entry and cell-state-dependent fate outputs of injury-reactivated tectal radial glia in zebrafish
- Other Figures
- All Figure Page
- Back to All Figure Page
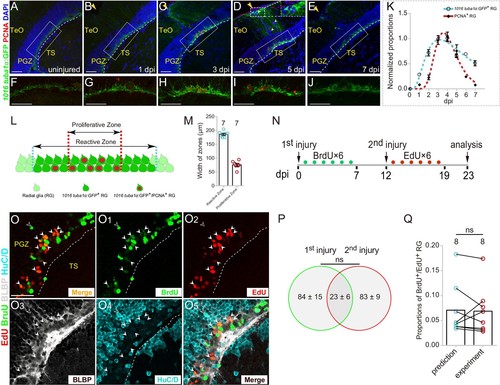
Injury-reactivated RG enter the cell cycle in a stochastic manner.(A–J) Low- and high-magnification immunofluorescence images showing the dynamics of GFP and PCNA of RG underneath the injury sites (yellow arrows) in the optic tecta of the Tg(1016tuba1α:GFP) fish throughout 0 to 7 dpi. At 3 and 5 dpi, GFP is strongly upregulated in the cell body and radial processes (white dashed box in (D)). Some GFP−/PCNA+ cells (white arrowheads in (D)) are non-RG proliferative cells induced by injury. (F–J) The high-magnification images of boxed areas in (B–E). See also Figure 2—figure supplement 1D-H3. (K) Dot plots showing the change of normalized proportions of GFP+ (open circles, the cyan dashed line representing a fitting curve) and PCNA+(solid diamonds, the red dashed line representing a fitting curve) RG throughout 0 to 7 dpi. The numbers are fitted by lognormal nonlinear regression. (n = 3, 3, 3, 3, 3, 3, 3, 3 for GFP; n = 3, 4, 4, 10, 9, 3, 3, 2 for PCNA). See also Figure 2—figure supplement 1C. (L and M) Schematic representation and quantification of the physical distribution of Reactive and Proliferative Zones in the injured optic tectum of Tg(1016tuba1α:GFP) fish. GFP is upregulated in RG in Reactive Zone and Proliferative Zone, 88 ± 3% (n = 7, mean ± SEM) proliferative RG (PCNA+/GFP+) are located in Proliferative Zone. (N) Experimental time course of the sequential injury experiment shown in (O–O5). Six consecutive days of BrdU (green dots) are injected after the first injury, and the second injury was applied at 12 dpi followed by EdU injections for six consecutive days (red dots), and finally, fish were analyzed at 23 dpi. (O–O5) BLBP (gray), HuC/D (cyan), BrdU (green) and EdU (red) immunofluorescences show that proliferative RG that respond to the stab injury of either the first time (BrdU+/BLBP+, green cells) or the second time (EdU+/BLBP+, red cells) are distinct but overlapping. RG that respond to both injuries are BrdU+/EdU+/BLBP+ (yellow cells) indicated by white arrowheads. The open white arrowheads indicate a newborn neuron (BrdU+/HuC/D+) generated from the RG respond to the first injury. Venn diagram of the number of RG that enter the cell cycle in a sequential injury experiment. No significant difference is shown between the number of RG induced by the first and the second injury (mean ± SEM; ns, p>0.05; Wilcoxon test). The predicted and experimental proportions of RG entering cell cycle in response to the injury of both times showing no significant difference. The prediction is derived from the multiplication of the reactivation probabilities of either injury, with the assumption of stochastic cell-cycle entry of reactive RG (mean ± SEM; ns, p>0.05; Wilcoxon test). The numbers above the bars indicate the animals used. White dashed lines represent the tectal ventricle boundary. RG, radial glia; TeO, tectum opticum; PGZ, periventricular gray zone; TS, torus semicircularis. Scale bars, 50 μm (A–J); and 30 μm (O–O5) |