
Fig. 2-S1
- ID
- ZDB-FIG-191014-16
- Publication
- Yu et al., 2019 - Stochastic cell-cycle entry and cell-state-dependent fate outputs of injury-reactivated tectal radial glia in zebrafish
- Other Figures
- All Figure Page
- Back to All Figure Page
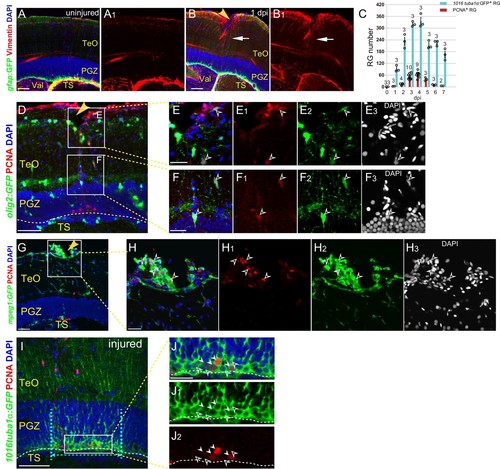
Injury induces proliferation of other cell types.(A–B1) Representative images of Tg(gfap:GFP) (green) and Vimentin (red) immunofluorescences showing that stab injury results in up-regulation of glial markers Vimentin (red, white arrows in (B and B1)) in RG underneath the injury site compared with the RG in control hemisphere at 1 dpi. (C) Quantification of the RG with robust GFP signal and RG with GFP+/PCNA+ signals underneath the injury site in the optic tecta of the Tg(1016tuba1α:GFP) fish throughout 0 to 7 dpi. (D–F3) Representative images of Tg(olig2:GFP) (green) and PCNA (red) immunofluorescences showing that injury induces proliferation of oligodendrocyte precursor cells in the regions near (E–E3) and underneath (F–F3) the injury site. (E–F3) The high-magnification images of boxed areas shown in (D). Tg(olig2:GFP) is a widely used line that labels oligodendrocytes and their precursor cells in zebrafish. Open white arrowheads in (E–F3) indicate the PCNA+/GFP+ oligodendrocyte precursor cells. (G–H3) Representative images of Tg(mpeg1:GFP) (green) and PCNA immunofluorescences showing injury induces proliferation of microglia/macrophage in the regions near the injury site. (H–H3) The high-magnification images of boxed area shown in (G). Tg(mpeg1:GFP) is a widely used line that labels microglia/macrophage in zebrafish. Open white arrowheads in (H–H3) indicate the PCNA+/GFP+ microglia/macrophage. The GFP-/PCNA+ cells are other proliferative cell types. (I–J2) Injury induces expression of GFP in all of the RG (green, cyan dashed lines) underneath the injury site in the Tg(1016tuba1α:GFP) fish optic tectum, whereas only a subset of the RG express PCNA (white arrowheads in J- J2). (J–J2) The high-magnification images of boxed area shown in (I). Cyan dashed lines indicate the boundary of Reactive Zone; Open white arrowheads indicate PCNA− RG in the Proliferative Zone. The numbers above the bars indicate the animals used. White dashed lines represent the tectal ventricle boundary. RG, radial glia; TeO, tectal opticum; PGZ, periventricular gray zone; TS, torus semicircularis; Val, valvula cerebelli. Scale bars, 50 μm (A-B1, D, G, and I); 20 μm (E1–E3, F1–F3, H–H3 and J–J2). |