
Fig. 6
- ID
- ZDB-FIG-191014-23
- Publication
- Yu et al., 2019 - Stochastic cell-cycle entry and cell-state-dependent fate outputs of injury-reactivated tectal radial glia in zebrafish
- Other Figures
- All Figure Page
- Back to All Figure Page
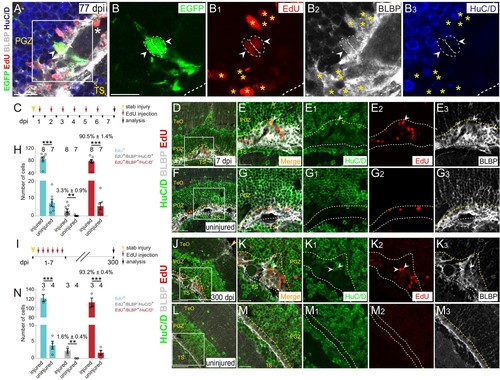
Injury-induced RG are largely undergoing gliogenesis.(A–B3) Images of a representative 2 cells clone at 77 dpi. Both cells are EdU+/BLBP+/HuC/D− RG (white arrowheads, white dashed circles). The white asterisk in (A) indicates the blood vessel. Yellow asterisks in (B1–B3) indicate other EdU+/BLBP+/HuC/D− RG underneath the injury site at 77 dpi. (B–B3) The high-magnification images of the boxed area in (A) (C) A schematic showing the procedures used for 7 days EdU pulse-and-stain assay. Fish are injected with EdU for six consecutive days after the injury, the injured and uninjured optic tecta are analyzed at 7 dpi. (D–G3) Representative images of EdU (red), BLBP (gray) and HuC/D (green) immunofluorescences showing that most of the newborn cells are EdU+/BLBP+ RG, while a few newborn cells are EdU+/HuC/D+ neurons (white arrowheads). The newborn RG forms a bulge underneath the injury site. (E-E3) The high-magnification images of the boxed area in (D). (F) The representative image of uninjured optic tectum. (G–G3) The high-magnification images of the boxed area in (F). (H) Quantification of EdU+newborn cells, EdU+/BLBP+/HuC/D− newborn RG and EdU+/BLBP−/HuC/D+ newborn neurons at 7 dpi. The number of EdU+/BLBP−/HuC/D+ newborn neurons on the injured side is significantly increased compared with that on the uninjured side (mean ± SEM; ***p<0.001, **p<0.01, Wilcoxon test). See also Figure 6—source data 1 for quantification. (I) A schematic showing the procedure of EdU pulse-and-staining assay for 300 days long-term tracing. Fish are injected with EdU for six consecutive days after the injury, the injured and uninjured optic tecta are analyzed at 300 dpi. (J–M3) Representative images of EdU (red), BLBP (gray) and HuC/D (green) immunofluorescences showing that EdU+ newborn cells that survive up to 300 dpi are largely EdU+/BLBP+ newborn RG, but a few cells are EdU+/HuC/D+ newborn neurons (white arrowheads). (K–K3) The high-magnification representative images of the boxed area in (J). (L) The representative image of uninjured optic tectum. (M–M3) The high-magnification representative images of the boxed area in (L). (N) Quantification of EdU+ newborn cells, EdU+/BLBP+/HuC/D− newborn RG and EdU+/BLBP−/HuC/D+newborn neurons at 300 dpi (mean ± SEM, ***p<0.001, *p<0.05, Wilcoxon test). See also Figure 6—source data 2 for quantification. The numbers above the bars indicate the animals used. White dashed lines represent the tectal ventricle boundary. Yellow dashed lines indicate the boundary of bulges. RG, radial glia; TeO, tectum opticum; PGZ, periventricular gray zone; TS, torus semicircularis. Scale bars, 20 μm (A-B3, E-E3, G-G3, K-K3, and M-M3); 50 μm (D, F, J and L). |