
Fig. 1
- ID
- ZDB-FIG-191014-13
- Publication
- Yu et al., 2019 - Stochastic cell-cycle entry and cell-state-dependent fate outputs of injury-reactivated tectal radial glia in zebrafish
- Other Figures
- All Figure Page
- Back to All Figure Page
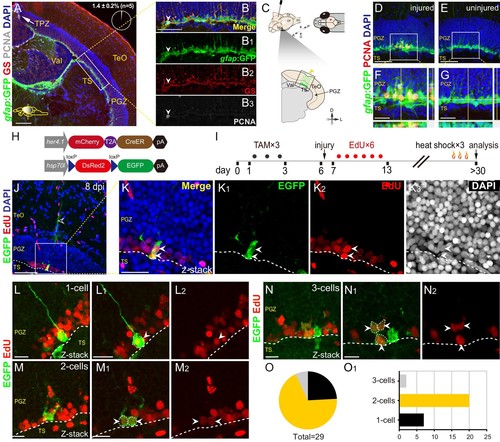
Injury reactivates dormant RG to proliferate and divide.(A–B3) Tg(gfap:GFP) (green), GS (red) and PCNA (gray) immunofluorescences show that PCNA+ proliferative cells (gray cells) are restricted to the TPZ (white arrow in (A)) and very few radial glia (RG) (1.4 ± 0.2%, n = 5, mean ± SEM, gray cells, white arrowheads in (B–B3)) is PCNA+. (B–B3) The high-magnification images of the boxed area (white box) in (A). (C) Schematic representation of stab injury assay. A 30G needle is stabbed into the central-dorsal region of the right hemisphere of zebrafish optic tectum. The red asterisk and yellow arrowhead indicates the injury site. RG (green cells) at the bottom of PGZ underneath the injury site are analyzed. (D–G) Tg(gfap:GFP) (green) and PCNA (red) immunofluorescences show that injury induces the proliferation of RG (GFP+/PCNA+, yellow cells) underneath the injury site at 3 days post-injury (dpi). (F and G) The high-magnification images of boxed areas in (D) and (E), respectively. (H) The design of Cre-loxP transgenic fish lines used for clonal analysis of individual tectal RG. Fish expressing mCherryT2ACreERT2 controlled by the her4.1-promotor are crossed to red-to-green reporter fish controlled by the hsp70l promoter. In Tg(her4.1:mCherry-CreERT2×hsp70l:DsRed2(floxed)EGFP) double transgenic fish, EGFP expression is specifically induced in her4.1-expressing RG and their progeny by TAM applications and heat shocks. (I) Experimental time course of Cre-loxP-based clonal analysis experiments shown in (J–O1). Double transgenic fish are administrated with TAM for three consecutive days (black dots) before the injury. EdU is injected to the injured fish to label the newborn cells for six consecutive days (red dots). Fish (21 to 24 dpi) are heat-shocked to induce EGFP expression in recombined cells and their progeny. (J–K3) Representative RG-derived clone (EGFP+/EdU+, white arrows) underneath the injury site at 8 dpi. (K–K3) The high-magnification images of the boxed area in (J). Two EGFP+/EdU+ (white arrowheads) cells and an EGFP+ radial process (open white arrowhead in (J)) are found underneath the injury site in this clone. (L–N2) Representative 1 cell (L–L2), 2 cells (M–M2) and 3 cells clones (N–N2) derived from single RG in response to the stab injury. In these clones, cells are EGFP+/EdU+newborn cells (white arrowheads). (O and O1) The size distribution of collected 29 clones. 2-cells clones (20/29) are the most abundant clones. White dashed lines represent the tectal ventricle boundary. A, anterior; P, posterior; D, dorsal; V, ventral; L, lateral; Tel, telencephalon; OT, optic tectum; Ce, cerebellum; SC, spinal cord; TAM, tamoxifen; RG, radial glia; TeO, tectum opticum; TPZ, tectal proliferation zone; PGZ, periventricular gray zone; TS, torus semicircularis; Val, valvula cerebelli. Scale bars, 100 μm (A); 50 μm (B-B3, D-G, and J); 20 μm (K–K3); and 10 μm (L–N2). |