
Fig. 3
- ID
- ZDB-FIG-191014-17
- Publication
- Yu et al., 2019 - Stochastic cell-cycle entry and cell-state-dependent fate outputs of injury-reactivated tectal radial glia in zebrafish
- Other Figures
- All Figure Page
- Back to All Figure Page
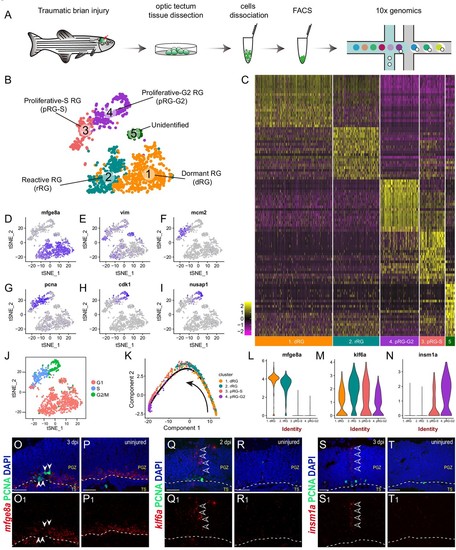
Single-cell RNAseq revealing cellular states underlying the cell-cycle entry of reactive RG.(A) Workflow for single-cell RNA-seq (scRNA-seq) of tectal RG after stab injury. Optic tecta are dissected from 3 dpi Tg(gfap:GFP) zebrafish brain and dissociated into a single-cell suspension. Single GFP+ RG are sorted by fluorescence-activated cell sorting (FACS) and followed by 10x genomics scRNA-seq. (B) A t-SNE plot of 1174 single tectal RG at 3 dpi revealing 5 cell clusters. Dormant RG (dRG, cluster 1) in orange; Reactive RG (rRG, cluster 2) RG in dark cyan; Proliferative-S RG (pRG-S, cluster 3) in Indian red; Proliferative-G2 RG (pRG-G2, cluster 4) in purple; Unidentified RG (cluster 5) in dark green. (C) Heatmap showing the expression of the top 20 marker genes that characterize each cell clusters. Rows represent genes while columns represent cells. (D–I) t-SNE plots showing expression of state-specific genes of distinct cell states. (J) Cell-cycle characteristics of individual cell states. S phase-related genes are mainly expressed in pRG-S cluster (cluster 3), G2/M-related genes are mainly expressed in pRG-G2 cluster (cluster 4). (K) Pseudo-time developmental trajectory of identified states using Monocle showing that the trajectory is booted from dRG cluster (cluster 1) and end at pRG-G2 cluster (cluster 4). (L–N) Violin plots of expression for genes enriched in dRG cluster (mfge8a, cluster 1), rRG cluster (klf6a, cluster 2) and pRG-S/G2 cluster (insm1a, cluster 3 and 4). (O–T1) In situ hybridization showing the expression of mfge8a (O–P1), klf6a (Q–R1) and insm1a (Q–R1) in the optic tecta after injury. The white arrowheads shown in (O and O1) indicate PCNA+ proliferative RG are mfge8a−, the open white arrowheads indicate klf6a (Q and Q1) or insm1a (S and T1) mRNA signals are located in processes of proliferative RG. White dashed lines represent the tectal ventricle boundary. t-SNE, t-stochastic neighbor embedding; RG, radial glia; PGZ, periventricular gray zone, TS, torus semicircularis. Scale bars, 30 μm. |