
Fig. 1
- ID
- ZDB-FIG-190604-19
- Publication
- Ahmed Alfar et al., 2017 - Distinct Levels of Reactive Oxygen Species Coordinate Metabolic Activity with Beta-cell Mass Plasticity
- Other Figures
- All Figure Page
- Back to All Figure Page
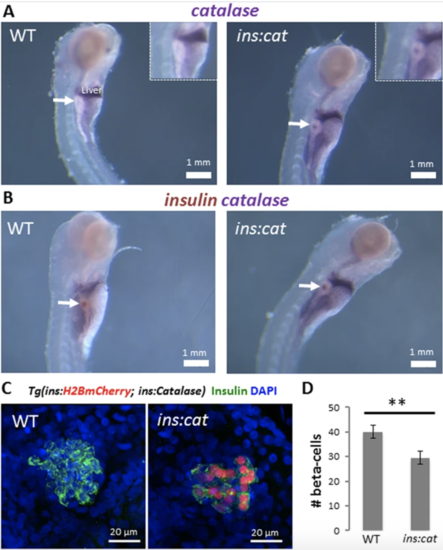
Catalase expression in beta-cells leads to a reduction in beta-cell numbers in larvae. (A) Whole mount in situ hybridization (WISH) for catalase in WT and Tg(ins:catalase;ins:H2BmCherry) larvae at 5 dpf. Arrows point to the principal islet. Catalase expression was not detected in the beta-cells of WT larvae whereas Tg(ins:catalase;ins:H2BmCherry) larvae exhibit catalase transcripts. (B) Double WISH for insulin (brown) and catalase (purple) showing overlap between the insulin and catalase transcripts in Tg(ins:catalase;ins:H2BmCherry) siblings. (C) Confocal projections of the principal islets of 4 dpf WT and Tg(ins:catalase;ins:H2BmCherry) larvae. (D) Quantification of the average number of beta-cell in WT (n = 15 larvae) and Tg(ins:catalase;ins:H2BmCherry) larvae (n = 12 larvae). Tg(ins:catalase;ins:H2BmCherry) larvae exhibit a reduced beta-cell number compared to WT (p = 0,008, error bars = SEM).
|
| Genes: | |
|---|---|
| Fish: | |
| Anatomical Terms: | |
| Stage Range: | Day 4 to Day 5 |
| Fish: | |
|---|---|
| Observed In: | |
| Stage: | Day 4 |