
Fig. 2
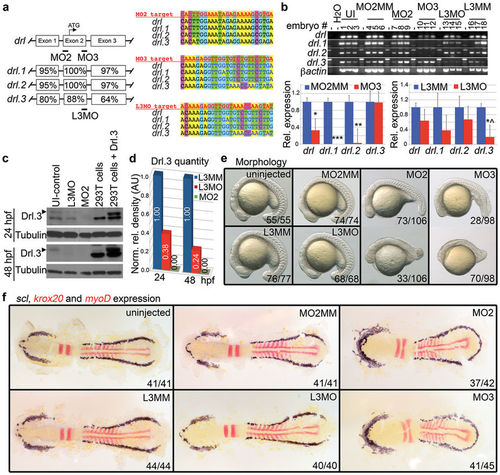
Knockdown of the drl gene family causes developmental defects. (a) (Left panel) Diagram comparing exon homology and showing the location of morpholino-targeted sequences. The percent homology for each exon compared to drl is indicated. (Right panel) Alignment of morpholino target sequence (in red) compared to corresponding sequence in each drl family member. DNA base pairs are color-coded. (b) (Upper panel) Individual embryo RT-PCR analysis of drl family members in control and morpholino-injected embryos as indicated. MM indicates a 5 base pair mismatch control morpholino. UI = uninjected. (Lower panels) Quantitation of drl gene family transcripts from RT-PCR analysis. (Left) Control (MO2MM) versus MO3 samples. (Right) Control (L3MM) compared to L3MO samples. Samples were normalized to β-actin. Rel. = Relative. Bars show mean ± S.D. from triplicates; *P = 0.0382, **P = 0.0088, ***P < 0.0001 and |
 (Student's t-test). (c) Detection of Drl.3 protein and Tubulin in 24 and 48 hpf lysates extracted from uninjected (UI), L3MO- or MO2-injected embryos, 293T cells, and 293T cells expressing Drl.3. (d) Quantitation of Drl.3 from Western blot analysis (from c, normalized to Tubulin). Norm. rel. = normalized relative; AU = arbitrary units. (e) Bright field microscopy of uninjected, control morpholino-injected embryos (MO2MM and L3MM) and morpholino injected-embryos at 18 somites. Lateral views, head to the left, dorsal upward. (f) WISH of scl (dark blue), krox20 (red, rhombomeres 3 and 5), and myoD (red, somites) in 9–10 somite stage embryos. Dorsal views of flat mounted embryos, anterior to left. (e–f) The number of the embryos with the representative phenotype per total number of embryos is indicated for each panel. Full-length gel images and western exposures for the cropped panels (b–c) are shown in Supplemental Figure 8.
| Genes: | |
|---|---|
| Antibody: | |
| Fish: | |
| Knockdown Reagents: | |
| Anatomical Term: | |
| Stage Range: | Prim-5 to Long-pec |
| Fish: | |
|---|---|
| Knockdown Reagents: | |
| Observed In: | |
| Stage Range: | 14-19 somites to Long-pec |