
Fig. 7
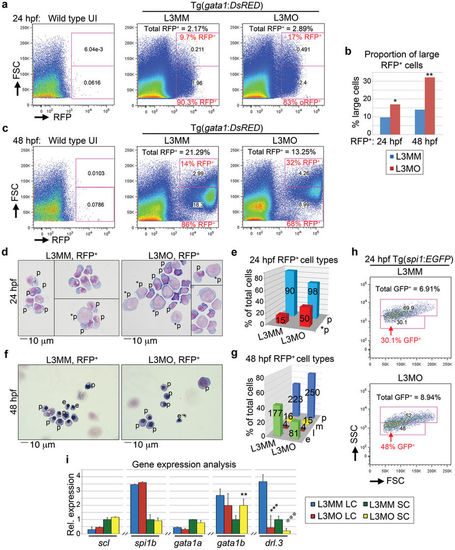
(a) FACS plots of 24 hpf cells from wild-type uninjected (UI) and Tg(gata1:DsRED) embryos injected with L3MM or L3MO as indicated. (b) Quantitation of the percent of large cells RFP+ populations from FACS analysis of L3MM- (blue) and L3MO-injected (red) Tg(gata1:DsRED) embryos, as indicated. *P = 0.0107; **P = 0.0021 (Chi-Squared test). (c) FACS plots of 48 hpf cells from wild-type uninjected (UI) and Tg(gata1:DsRED) embryos injected with L3MM and L3MO as indicated. (a, c) The percent of RFP+ cells out of total cells and the percent of large (FSC high) and smaller sized cell (FSC low) populations are indicated. (d) May-Grunwald-Giemsa (MGG) staining of purified Tg(gata1:DsRED) cells from the indicated 24 hpf morphants. *p = less differentiated progenitor cell; p = progenitor cell, more differentiated. (e) Cell type distribution in purified Tg(gata1:DsRED) cells at 24 hpf based on MGG staining. L3MM versus L3MO (*p and p cells), P = 0.0004 (Fisher's exact test). (f–g) MGG staining of purified 48 hpf Tg(gata1:DsRED) cells (f) and quantitation of MGG cell type distribution (g). p = progenitor cells; e = erythroid cells (≤8 μm); m = myeloid; l = lymphoid. L3MM versus L3MO (e and p cells), P < 0.0001 (Fisher's exact test). The yellow-blue color balance of merged L3MM and L3MO images was slightly adjusted in Photoshop. (e, g) The cell count for each cell type is indicated in the appropriate column. (h) FACS plots of cells from 24 hpf Tg(spi1:EGFP) L3MM- (top) and L3MO-(bottom) injected embryos. An arrow indicates the less mature population (P = 0.0069, Chi-squared test). Supplementary Figure S6a–b shows gating for GFP+ cells. (i) Real-time PCR of scl, spi1b, gata1a, gata1b, and drl.3 in purified large and small size populations of gata1:RFP+ cells from 24 hpf L3MM- and L3MO-injected embryos. The relative expression in small L3MM cells was set to 1, arbitrary units. Expression was normalized to gapdh. Bars show mean ± S.D., triplicate experiments. **P = 0.0083, ***P = 0.0004, and ***P = 0.0009 (Student's t-test). |
| Fish: | |
|---|---|
| Knockdown Reagent: | |
| Observed In: | |
| Stage Range: | Prim-5 to Long-pec |