
Fig. S1
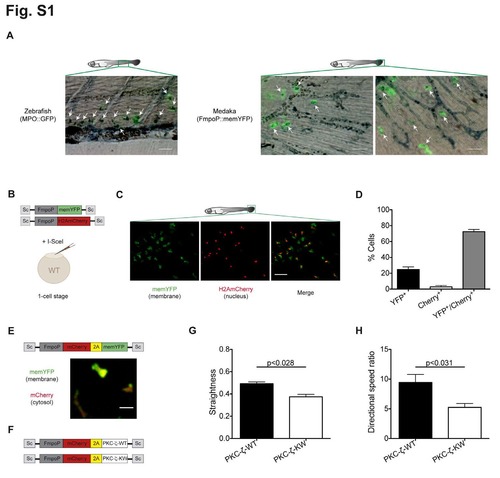
Transient expression of transgenes in myeloid cells in vivo, related to Fig. 1. (A) Sudan black (SB) staining of zebrafish MPO::GFP (left panel) or medaka FmpoP::memYFP larvae (right panel), respectively at 3 or 11dpf. White arrows indicate GFP+ SB+ (left panel) or memYFP+ SB+ (right panel) leukocytes. Scale bars = 20 μm. (B) Outline of the experimental strategy used to co-express two transgenes in medaka myeloid cells. Wild-type Cab embryos were injected at the one-cell stage with a 1:1 mixture of DNA coding for H2AmCherry as a nuclear reporter and membrane-tethered YFP, driven by the myeloid cell-specific Fmpo promoter and flanked by I-SceI integration sites (Sc), in the presence of I-SceI meganuclease. (C) Top, illustration of the location in the fish larval tailfin imaged for the analysis of coexpression of two transgenes in live myeloid cells. Bottom, representative images of larvae containing single (YFP+; Cherry+) and double (YFP+ Cherry+14 ) positive cells within the region highlighted. Scale bar = 50 μm. (D) Quantification of the degree of coexpression of two transgenes (YFP+ Cherry+ - gray bar) in live myeloid cells. Data are expressed as means ± s.e.m. of three independent experiments (173 leukocytes from 3 separate larvae). (E) Top, schematics of the reporter construct used to express mCherry and memYFP linked by a self-cleavable viral P2A peptide in medaka myeloid cells. Bottom, independent expression of mCherry and memYFP protein products in medaka leukocytes from the mCherry-P2A-memYFP transgene. Scale bar = 20 μm. (F) Schematics of the constructs used to express mCherry and PKC-ζ variants linked by a self-cleavable viral P2A peptide in medaka myeloid cells. (G and H) Quantitation of 2D (G) path straightness and (H) directional speed ratio (Vy/Vx) of mCherry- P2A+ PKC-ζ+ myeloid cells during the wound response. Data are expressed as means ± s.e.m. of at least two separate experiments (PKC-ζ-WT: n = 30 cells in 2 larvae, PKC-ζ-KW: n = 53 cells in 4 larvae; * p < 0.05, two-tailed unpaired Student’s t-test). |