
Fig. 5
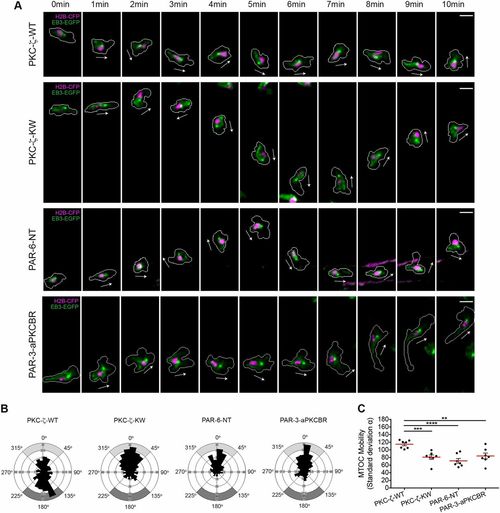
The PAR complex regulates the MTOC perinuclear positioning during wound-directed migration of leukocytes in vivo. (A) The microtubules and the nucleus are visualized in migrating leukocytes generated as described for Fig. 4. The white arrows indicate the direction of migration. Cell outlines are shown as gray lines. Scale bars: 10 µm. (B) Rose diagrams mapping the orientation of the MTOC and the respective spatial frequency in migrating myeloid cells [PKC-ζ-WT, 265 counts (seven leukocytes in six larvae); PKC-ζ-KW, 347 counts (seven leukocytes in five larvae); PAR-6-NT, 235 counts (seven leukocytes in five larvae); PAR-3-aPKCBR, 307 counts (seven leukocytes in five larvae)]. Gray areas indicate front or back orientation as in Fig. 3. (C) Comparison of MTOC perinuclear mobility in migrating myeloid cells as described in Fig. 3D (PKC-ζ-WT, seven leukocytes in six larvae; PKC-ζ-KW, seven leukocytes in five larvae; PAR-6-NT, seven leukocytes in five larvae; PAR-3-aPKCBR, seven leukocytes in five larvae); **P<0.01; ***P<0.001; ****P<0.0001 (two-tailed unpaired Student's t-test). See also supplementary material Table S1; Movie 7. |