
Fig. 6
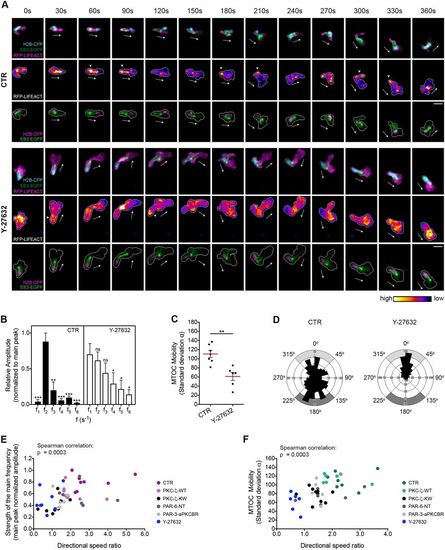
Rho-kinase-dependent actomyosin contraction is required for MTOC dynamic positioning in leukocytes migrating to wounds in vivo. (A) F-actin (upper and middle panels), the microtubules and the nucleus (upper and lower panels) are visualized in control (CTR) or Y-27632-treated transgenic larvae generated as described for Fig. 2. Frames from representative movies of migrating myeloid cells in wounded tailfins are shown. The white arrows indicate the direction of migration. The arrowheads point to F-actin accumulation at the trailing edge of the cell. Cell outlines are shown as a gray line. Scale bars: 10 µm. (B) Comparison of histograms of F-actin oscillatory frequencies in the back region of the cell [ranges (s−1) as shown in Fig. 2G]. Data are expressed as the mean±s.e.m. of all analyzed cells (control, eight leukocytes in four larvae; Y-27632, seven leukocytes in three larvae); *P<0.05; **P<0.01; ***P<0.001; ns, non-significant (two-tailed paired Student's t-test). (C) Comparison of MTOC mobility as described for Fig. 3D (control, seven leukocytes in five larvae; Y-27632, six leukocytes in four larvae); **P<0.01 (two-tailed unpaired Student's t-test). (D) Rose diagrams mapping the orientation of the MTOC and its spatial frequency [control, 230 counts (seven leukocytes in five larvae); Y-27632, 524 counts (six leukocytes in four larvae)]. Gray areas indicate front or back orientation as in Fig. 3. (E,F) The strength of the main frequency of F-actin oscillations in the back region (E) is plotted against directional speed ratio. Shown is the normalized amplitude of the main frequency peak in the Fourier spectra (44 leukocytes, R Spearman = 0.5149). MTOC perinuclear mobility (F) is plotted against directional speed ratio (41 leukocytes, R Spearman = 0.5416). ***P (two-tailed)<0.001. See also supplementary material Fig. S3E,F; Table S1; Movies 8, 9. |