
Fig. 7
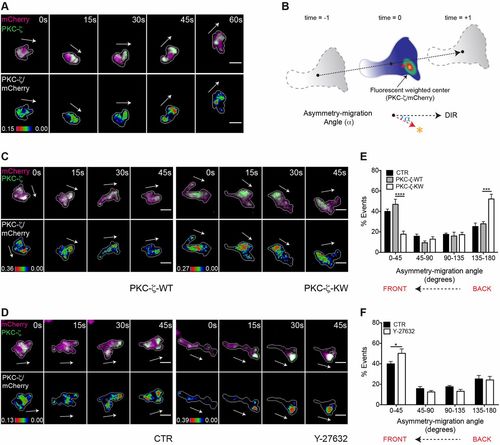
The catalytic activity of PKC-ζ is essential for its polarized localization in leukocytes migrating in vivo. For A,C and D, Frames from representative movies of migrating myeloid cells in wounded tailfins are shown. The white arrows indicate the direction of migration. Cell outlines are drawn as a gray line. Scale bars: 10 µm. (A) Upper panel, mCherry and GFP–PKC-ζ were visualized in TG(FmpoP::mCherry) larvae transiently expressing GFP–PKC-ζ in myeloid cells. Lower panel, ratiometric GFP–PKC-ζ∶mCherry images were generated using mCherry as a volumetric control. (B) Schematics of the 2D analysis of protein asymmetry during cell migration. Black dots indicate the cell centroid shown at three consecutive time-points, and the dashed black arrow indicates the direction of migration. The asterisk represents the fluorescence center of ratiometric signal, and the dashed red arrow from the cell centroid to the fluorescence center is the asymmetry vector. The angle α between the asymmetry vector and the direction of migration (blue arc) is defined as the asymmetry-migration angle, which approaches 180° for a protein that is located at the back of the cell. (C) Upper panel, mCherry and GFP–PKC-ζ were visualized in TG(FmpoP::mCherry) transgenic larvae transiently expressing GFP–PKC-ζ together with PKC-ζ-WT or PKC-ζ-KW in myeloid cells. Lower panel, ratiometric GFP–PKC-ζ∶mCherry images were created. (D) Upper panel, mCherry and GFP–PKC-ζ were visualized in control or Y-27632-treated transgenic larvae established as described for A. Lower panel, ratiometric images GFP–PKC-ζ∶mCherry were generated. (E,F) Histograms show the polarized distribution of ratiometric GFP–PKC-ζ∶mCherry images in migrating cells assessed using the asymmetry-migration angles. CTR, control. Data are expressed as the mean±s.e.m. of all analyzed cells (control, 15 leukocytes in four larvae; PKC-ζ-WT, eight leukocytes in four larvae; PKC-ζ-KW, ten leukocytes in three larvae; Y-27632, 11 leukocytes in four larvae); *P<0.05; ***P<0.001; ****P<0.0001 (two-tailed unpaired Student's t-test). See also supplementary material Movies 10, 11. |