
Fig. 3
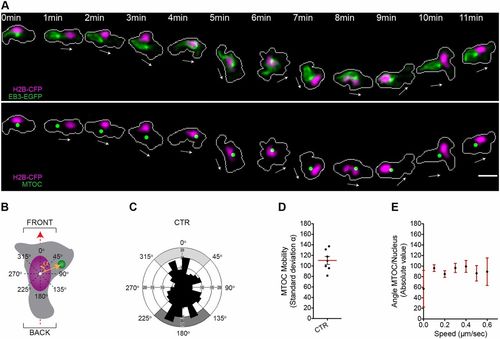
The MTOC is highly mobile in the perinuclear compartment of leukocytes migrating to wounds in vivo. (A) The microtubules and the nucleus are visualized in a migrating leukocyte generated as described for Fig. 2. Upper panel, fluorescence images; lower panel, green dots represent a digitalized reconstruction of the MTOC position. The white arrows indicate the direction of migration. Cell outlines are shown as gray lines. Scale bar: 10 µm. (B) Schematic of the 2D analysis of MTOC perinuclear positioning during migration. The dashed red arrow indicates the direction of migration defined as in Fig. 2. The yellow arrow originating from the nuclear centroid (white dot) to the MTOC is the MTOC–nucleus vector. The angle α between the MTOC–nucleus vector and the direction-of-migration vector is the MTOC-nucleus angle (orange arc). (C) Rose diagram mapping the MTOC orientation and the respective spatial frequency of events in migrating myeloid cells (230 counts, seven leukocytes in five larvae). Light or dark gray areas correspond to 90° ranges for front or back orientations, respectively. CTR, control. (D) Quantification of MTOC perinuclear mobility in migrating myeloid cells. MTOC mobility for each cell is represented by the standard deviation associated with the MTOC-nucleus angle during the response to wounding. The red line shows the mean (±s.e.m.) for all cells analyzed (seven leukocytes in five larvae). (E) MTOC perinuclear orientation is plotted against cellular speed. For each range of speed, data represents the mean±s.e.m. (226 counts, seven leukocytes in five larvae); R Spearman = 0.008, P (two-tailed) = 0.8932 (non-significant). See also supplementary material Fig. S3A–D; Table S1; Movie 5. |