
Fig. 4
- ID
- ZDB-FIG-150331-39
- Publication
- Wakayama et al., 2015 - Cdc42 Mediates Bmp-Induced Sprouting Angiogenesis through Fmnl3-Driven Assembly of Endothelial Filopodia in Zebrafish
- Other Figures
- All Figure Page
- Back to All Figure Page
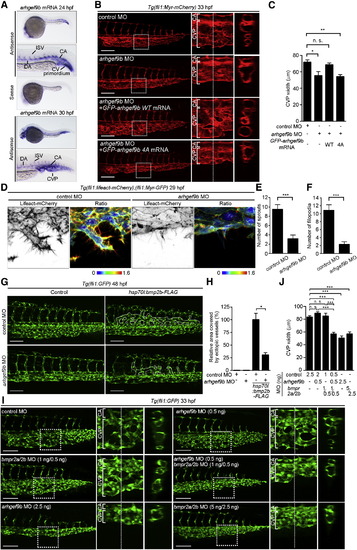
Arhgef9b, a Cdc42 GEF, Is Involved in Bmp-Mediated CVP Formation (A) Expression patterns of arhgef9b mRNA in zebrafish embryos at 24 and 30 hpf as detected by whole-mount in situ hybridization. The caudal region is enlarged in the lower panel. A sense probe was used to confirm the specificity of the hybridization reaction. DA, dorsal aorta; CA, caudal artery. (B) Projection views are shown of confocal z stack images of the caudal regions of 33 hpf Tg(fli1:Myr-mCherry) embryos injected with 2.5 ng control MO, 2.5 ng arhgef9b MO, and 2.5 ng arhgef9b MO, together with either 100 pg MO-resistant GFP-arhgef9b mRNA or 100 pg MO-resistant GFP-arhgef9b 4A mRNA as in Figure 1G. (C) The CVP width, as observed in (B), was quantified as in Figure 1H (control MO, n = 13; arhgef9b MO, n = 11; arhgef9b MO + GFP-arhgef9b WT mRNA [WT], n = 14; and arhgef9b MO + GFP-arhgef9b 4A mRNA [4A], n = 5). Error bars indicate means ± SEM. (D) 3D-rendered confocal images of the CVP of 29 hpf Tg(fli1:lifeact-mCherry);(fli1:Myr-GFP) embryos injected with 5 ng control MO and 5 ng arhgef9b MO are shown as in Figure 1A. (E) The number of sprouts extending from the CV primordia, as observed in (D), was quantified as in Figure 2B (control MO, n = 8; arhgef9b MO, n = 7). Error bars indicate means ± SEM. (F) The number of filopodia for each EC located at the vascular front, as observed in (D), was quantified as in Figure 1D (control MO, n = 8; arhgef9b MO, n = 7). Error bars indicate means ± SEM. (G) Projection view of confocal z stack images of the caudal regions of 48 hpf Tg(fli1:GFP) embryos injected with 2.5 ng control MO (upper panel) or 2.5 ng arhgef9b MO (lower panel), either alone (Control) or together with hsp70l:bmp2b-FLAG Tol2 plasmid. Dotted lines indicate ectopic venous vessels. (H) The areas covered by ectopic venous vessels, as observed in (G), were quantified and expressed as percentages relative to that observed in the embryos injected with both control MO and hsp70l:bmp2b-FLAG Tol2 plasmid. Data are shown as means ± SEM (each sample, n = 12). (I) Projection view of confocal z stack images of the caudal regions of 33 hpf Tg(fli1:GFP) embryos injected with control MO, both bmpr2a and bmp2rb MOs, and arhgef9b MO, as indicated in the upper left corner of each image, are shown as in Figure 1G. The amounts of injected MOs (per embryo) are also indicated in parentheses after the name of the MO. (J) The CVP width, as observed in (I), was quantified as in Figure 1H (n ≥ 5). Error bars indicate means ± SEM. Scale bars, 100 µm in (B), (G), and (I). p < 0.05; p < 0.01; p < 0.001; n.s., no significance. See also Figure S4. |
| Genes: | |
|---|---|
| Fish: | |
| Knockdown Reagents: | |
| Anatomical Terms: | |
| Stage Range: | Prim-5 to Long-pec |
| Fish: | |
|---|---|
| Knockdown Reagents: | |
| Observed In: | |
| Stage Range: | Prim-5 to Prim-15 |
Reprinted from Developmental Cell, 32, Wakayama, Y., Fukuhara, S., Ando, K., Matsuda, M., Mochizuki, N., Cdc42 Mediates Bmp-Induced Sprouting Angiogenesis through Fmnl3-Driven Assembly of Endothelial Filopodia in Zebrafish, 109-22, Copyright (2015) with permission from Elsevier. Full text @ Dev. Cell