
Fig. 2
- ID
- ZDB-FIG-150331-37
- Publication
- Wakayama et al., 2015 - Cdc42 Mediates Bmp-Induced Sprouting Angiogenesis through Fmnl3-Driven Assembly of Endothelial Filopodia in Zebrafish
- Other Figures
- All Figure Page
- Back to All Figure Page
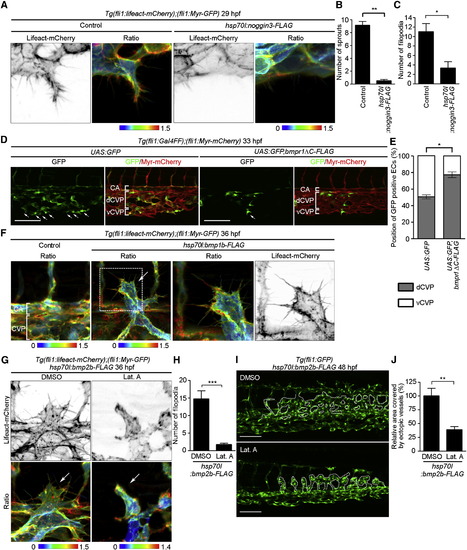
Bmp Induces EC to Extend into Filopodia during CVP Formation (A) 3D-rendered confocal 3D images of the CVP of 29 hpf Tg(fli1:lifeact-mCherry);(fli1:Myr-GFP) embryos injected without (Control) or with hsp70l:noggin3-FLAG-Tol2 plasmid and heat shocked at 22 hpf for 24 hr are shown as in Figure 1A. (B) The total number of sprouts extending from the CV primordia, as observed in (A), was counted and is shown as the mean ± SEM (Control, n = 5; hsp70l:noggin3-FLAG, n = 4). (C) The number of filopodia for each EC located at the vascular front, as observed in (A), was quantified as in Figure 1D (Control, n = 5; hsp70l:noggin3-FLAG, n = 4). Error bars indicate means ± SEM. (D) Projection view of confocal z stack images of the caudal regions of 33 hpf Tg(fli1:Gal4FF);(fli1:Myr-mCherry) embryos injected with UAS:GFP Tol2 vector (UAS:GFP) or UAS:GFP,bmpr1ΔC-FLAG Tol2 plasmid (UAS:GFP,bmpr1ΔC-FLAG). Left, GFP images; right, the merged images of GFP (green) and mCherry (red). Arrows indicate GFP-expressing ECs that localize in the ventral part of CVP. CA, caudal artery; dCVP, dorsal part of CVP; vCVP, ventral part of CVP. (E) Percentages of GFP-expressing ECs localizing in the dCVP or vCVP, as observed in (D), are shown as means ± SEM (UAS:GFP, n = 6; UAS:GFP, bmpr1ΔC-FLAG, n = 5). (F) 3D-rendered confocal images of the caudal regions of 36 hpf Tg(fli1:lifeact-mCherry);(fli1:Myr-GFP) embryos injected without (Control, left panel) or with hsp70l:bmp2b-FLAG Tol2 plasmid (right three panels) and heat shocked at 24 hpf for 30 min are shown as in Figure 1A. The mCherry/GFP ratio and mCherry images of the boxed area are enlarged in the third and fourth panels from the left, respectively. Arrow indicates ectopic venous vessels. (G) 3D-rendered confocal images of the caudal regions of 36 hpf Tg(fli1:lifeact-mCherry);(fli1:Myr-GFP) embryos injected with hsp70l:bmp2b-FLAG Tol2 plasmid, heat shocked at 24 hpf for 30 min and treated with DMSO or Lat. A from 29 to 33 hpf are shown as in Figure 1A. Arrows indicate ectopic venous vessels. (H) The number of filopodia for each EC located at the front of ectopic vessels, as observed in (G), was quantified as in Figure 1D (DMSO, n = 7; Lat. A, n = 7). Error bars indicate means ± SEM. (I) Projection view of confocal z stack images of the caudal regions of 48 hpf Tg(fli1:GFP) embryos injected with hsp70l:bmp2b-FLAG Tol2 plasmid, heat shocked at 24 hpf for 30 min, and treated with DMSO or Lat. A from 33 to 48 hpf. Dotted lines indicate ectopic venous vessels. (J) The areas covered by ectopic venous vessels as observed in (I) were quantified and expressed as percentages relative to that observed in DMSO-treated embryos. Data are shown as means ± SEM (DMSO, n = 5; Lat. A, n = 5). Scale bars, 100 µm in (D) and (I). p < 0.05; p < 0.01; p < 0.001. See also Figure S2 and Movie S4. |
| Gene: | |
|---|---|
| Fish: | |
| Anatomical Terms: | |
| Stage: | Prim-5 |
Reprinted from Developmental Cell, 32, Wakayama, Y., Fukuhara, S., Ando, K., Matsuda, M., Mochizuki, N., Cdc42 Mediates Bmp-Induced Sprouting Angiogenesis through Fmnl3-Driven Assembly of Endothelial Filopodia in Zebrafish, 109-22, Copyright (2015) with permission from Elsevier. Full text @ Dev. Cell