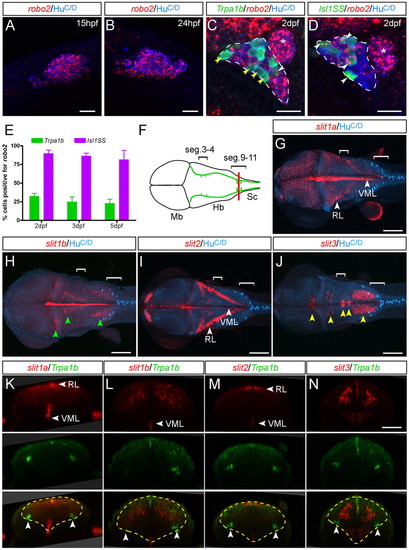
Expression of robo2 and Slit genes. (A,B) Trigeminal ganglion (cluster of blue cells, HuC/D positive) expresses robo2 (red speckles) in most cells at early stages. (C,D) Starting at 2 dpf, robo2 becomes differentially expressed in Tpra1b versus Isl1SS subtypes. The trigeminal ganglion is outlined (dashed lines); the anterior lateral line ganglion is located just posterior to it (asterisk) and is not labeled by either reporter line. (C) In the Trpa1b reporter line, most labeled trigeminal neurons (green cells) are negative for robo2 (yellow arrowheads), with a small proportion that are positive (white arrowhead). (D) In the Isl1SS reporter line, most labeled trigeminal neurons are positive for robo2 (white arrowheads). (E) Quantification of robo2 expression in the two subtypes at different developmental stages. robo2 expression is consistently higher in the Isl1SS subtype from 2-5 dpf. Error bars indicate s.e.m. (F) Diagram of a 3 dpf zebrafish brain viewed from the dorsal side, corresponding to images shown in G-J. Green lines show the trajectory of the trigeminal afferent track. Brackets indicate segments 3-4 and 9-11. (G-J) Whole-mount in situ hybridization for Slit genes co-stained for a neuronal marker (HuC/D). Images are maximal projections of confocal z-stacks. (G,I) slit1a and slit2 are strongly expressed in the ventral midline (VML) and rhombic lip (RL). (H) slit1b is expressed in the ventral midline as well as in several distinct nuclei in the hindbrain (green arrowheads). (J) slit3 is expressed in the cranial motor nuclei (yellow arrowheads). (K-N) Optical transverse sections at the hindbrain-spinal cord boundary (red line in F) of 3-dpf Trpa1b:GFP larvae stained for Slit genes (red) and Trpa1b:GFP (green). slit1a is also diffusely expressed in the caudal hindbrain (K). Yellow dashed lines mark the outlines of the hindbrain and arrowheads indicate trigeminal axons. Mb, midbrain; Hb, hindbrain; SC, spinal cord. Scale bars: 20 μm in A-D; 100 μm in G-J; 50 μm in K-N.
|
