|
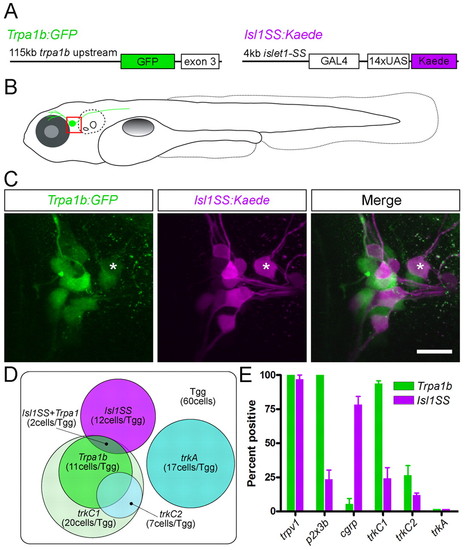
Trigeminal subtype reporter lines and marker gene expression. (A) Transgenic constructs used to generate Trpa1b:GFP (left) and Isl1SS:Kaede (right) transgenic lines. (B) Illustration of a trigeminal sensory neuron (green cell abutting the eye) in a fish at 5 dpf. The trigeminal ganglion (boxed area) is shown in C. (C) Trigeminal ganglion in a 5 dpf Trpa1b:GFP;Isl1SS:Kaede double-transgenic larva. GFP-positive (green) and Kaede-positive (magenta) trigeminal sensory neurons are largely distinct. Asterisk indicates a double-labeled cell. (D) Summary Venn diagram of distinct trigeminal subtypes defined by neurotrophin receptors (trkA and trkC1) and transgenic reporters. The box represents the entire trigeminal ganglion (Tgg) and circles indicate populations of trigeminal sensory neurons labeled by the markers indicated. (E) Quantification of marker gene expression (%) in each subset at 2 dpf. Error bars indicate s.e.m. Three to ten ganglia were counted for each marker. Scale bar: 20 μm.
|