FIGURE SUMMARY
Title

Pneumolysin-dependent and independent non-canonical autophagy processes mediate host defense against pneumococcal infection

Authors
Michno, B.J., Pooranachandran, N., Smith, T.C., Faught, E., Lipowská, S., Fenton, A.K., Meijer, A.H., Prajsnar, T.K.
Source
Full text @ Autophagy

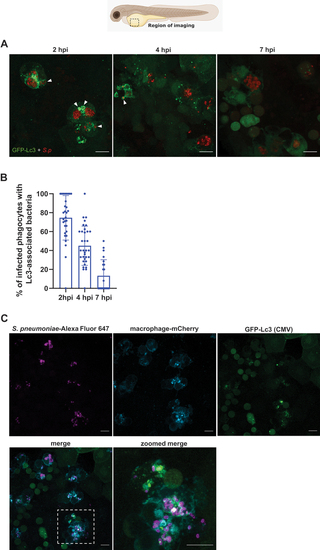
The autophagic response occurs during systemic infection with pneumococci. (A) Representative confocal images of CMV:GFP-Lc3 larvae infected systemically with approximately 1600 CFU of mKate2-labeled D39 Δcps S. pneumoniae and fixed at 2, 4 and 7 hpi. Scale bars: 10 µm. Arrowheads indicate Lc3-positive vacuoles containing bacteria. (B) Quantification of Lc3 associations with intracellular S. pneumoniae within infected phagocytes of fixed CMV:GFP-Lc3 at 2, 4 and 7 hpi. Data are shown as mean ± standard deviation (SD). Data obtained from two independent experiments (C) Representative confocal images of CMV:GFP-Lc3 mpeg:mCherry-F dual transgenic larvae infected systemically with approximately 1600 CFU of Alexa Fluor 647-stained D39 Δcps S. pneumoniae and fixed at 2 hpi.

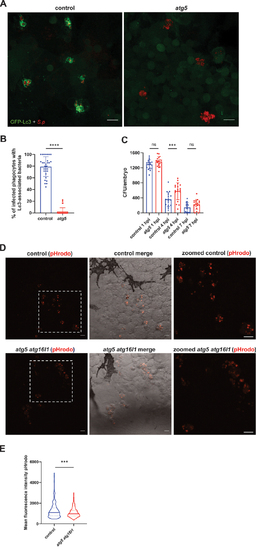
The autophagic response contributes to phagosomal acidification and pneumococcal clearance. (A) Representative confocal images of control (left panel) and atg5 knockdown (right panel) CMV:GFP-Lc3 larvae infected systemically with approximately 1600 CFU of mKate2-labeled D39 Δcps S. pneumoniae and fixed at 2 hpi. Scale bars: 10 µm. (B) Quantification of Lc3 associations with intracellular bacteria of control and atg5 knockdown larvae. Data are shown as individual values ± standard deviation (SD). Data obtained from two independent experiments. (C) Numbers of viable colony forming units (CFUs) control or atg5 knockdown larvae infected intravenously with approximately 1600 CFU of S. pneumoniae monitored at 1, 4, and 7 hpi. Data obtained from two independent experiments (D) Representative in vivo images of circulation valley of control (top) and atg5 atg16l1 knockdown larvae (bottom) at 2 hpi injected with S. pneumoniae D39 ∆cps prestained with pHrodo Red. Panels on the right represent zoomed-in areas (indicated by dashed squares). Scale bars represent 10 µm. (E) Quantification of pHrodo Red fluorescence intensity within phagocytes containing pneumococci. Data obtained from two independent experiments). **** - p < 0.0001, *** - p < 0.001, ns – not significant.

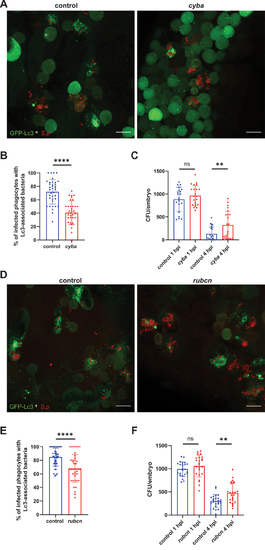
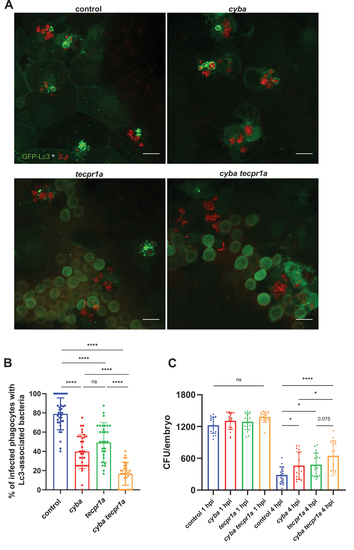
ROS-dependent autophagic response contribute to clearance of S. pneumoniae. (A, D) Representative confocal images of control and indicated gene knockdown (A – cyba, D - rubcn) CMV:GFP-Lc3 larvae infected systemically with approximately 1600 CFU of mKate2-labeled D39 Δcps S. pneumoniae and fixed at 2 hpi. Scale bars: 10 µm. (B, E) Quantification of Lc3 associations with intracellular S. pneumoniae within infected phagocytes of fixed CMV:GFP-Lc3 control and indicated gene knockdown (B – cyba, E - rubcn) larvae at 2 hpi. Data are shown as mean ± standard deviation (SD). Data obtained from three independent experiments. (C, F) Numbers of viable colony forming units (CFUs) over time of control and indicated gene knockdown (C – cyba, F - rubcn). Data obtained from three independent experiments.

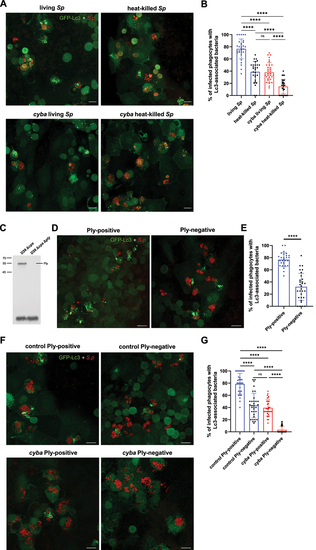
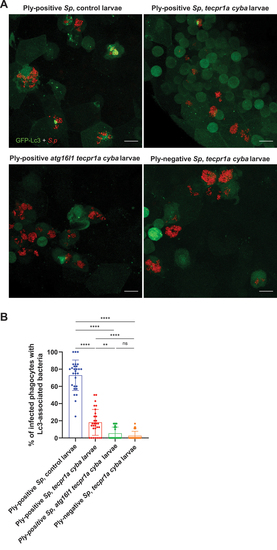
Live and pnemolysin-positive pneumococci are required to fully induce Lc3-mediated response within zebrafish macrophages. (A) Representative confocal images of CMV:GFP-Lc3 control (top two panels) or cyba knockdown (bottom two panels) larvae infected systemically with approximately 1600 CFU of live (left two panels) and heat-killed (right two panels) mKate2-labeled D39 Δcps S. pneumoniae fixed at 2 hpi. Scale bars: 10 µm. (B) Quantification of Lc3 associations with intracellular live or heat-killed S. pneumoniae within infected phagocytes of fixed CMV:GFP-Lc3 control or cyba larvae at 2 hpi. Data are shown as mean ± standard deviation (SD). Data obtained from two independent experiments. (C) Anti-Ply immunoblot analysis of whole-cell lysates from the indicated S. pneumoniae strains. The position of protein markers are indicated in kiloDaltons, Pneumolysin (Ply) ≈ 53.7 KDa. Representative blot shown, n = 4. (D) Representative confocal images of control CMV:GFP-Lc3 larvae infected systemically with approximately 1600 CFU of Ply-positive (D39 Δcps, left panel) and Ply-negative (D39 Δcps Δply, right panel) mKate2-labeled S. pneumoniae fixed at 2 hpi. Scale bars: 10 µm. (E) Quantification of Lc3 associations with intracellular Ply-positive or Ply-negative S. pneumoniae within infected phagocytes of fixed CMV:GFP-Lc3 larvae at 2 hpi. Data are shown as mean ± standard deviation (SD). Data obtained from two independent experiments. (F) Representative confocal images of CMV:GFP-Lc3 control (top two panels) or cyba knockdown (bottom two panels) larvae infected systemically with approximately 1600 CFU of Ply-positive (D39 Δcps, left two panels) and Ply-negative (D39 Δcps Δply, right two panels) mKate2-labeled S. pneumoniae fixed at 2 hpi. Scale bars: 10 µm. (G) Quantification of Lc3 associations with intracellular Ply-positive or Ply-negative S. pneumoniae within infected phagocytes of fixed CMV:GFP-Lc3 control or cyba larvae at 2 hpi. Data are shown as mean ± standard deviation (SD). Data obtained from two independent experiments.

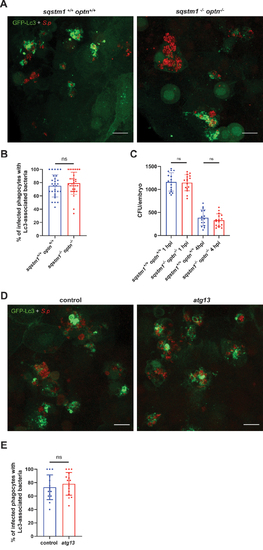
Sqstm1, optineurin and atg13 are not involved in autophagic response to S. pneumoniae. (A) Representative confocal images of sqstm1+/+optn+/+ and sqstm1−/−optn−/− double mutant CMV:GFP-Lc3 larvae infected systemically with approximately 1600 CFU of mKate2-labeled D39 Δcps S. pneumoniae and fixed at 2 hpi Scale bars: 10µm. (B) Quantification of Lc3 associations with intracellular S. pneumoniae within infected phagocytes of fixed CMV:GFP-Lc3 sqstm1+/+optn+/+ and sqstm1−/−optn−/− double mutant larvae. Data are shown as mean±standard deviation (SD). Data obtained from two independent experiments. (C) Numbers of viable colony forming units (CFUs) over time of sqstm1+/+optn+/+ and sqstm1−/−optn−/− double mutant larvae. Data obtained from two independent experiments. (D) Representative confocal images of control and atg13 knockdown (right panel) CMV:GFP-Lc3 larvae infected systemically with approximately 1600 CFU of mKate2-labeled D39 Δcps S. pneumoniae and fixed at 2 hpi Scale bars: 10µm. (E) Quantification of Lc3 associations with intracellular S. pneumoniae within infected phagocytes of fixed CMV:GFP-Lc3 control and atg13 knockdown larvae. Data are shown as mean±standard deviation (SD). n≥15 zebrafish larvae were analyzed.

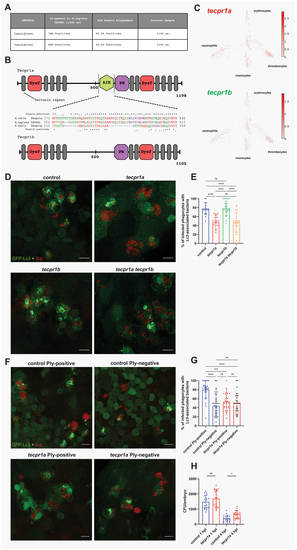
Tecpr1a, a likely ortholog of human TECPR1, controls ply-mediated autophagic response to pneumococci. (A) Table summarizing the alignment of zebrafish Tecpr1a and Tecpr1b proteins to the human TECPR1 protein. Columns display percentage positives (identical amino acids, as well as conserved or semiconserved substitutions) and length of the proteins. Alignments sequence similarities are shown for the full-length protein and the AIR domain, which exhibits the greatest divergence between the zebrafish paralogues (Tecpr1a and Tecpr1b). (B) Schematic representation of zebrafish Tecpr1a and Tecpr1b proteins, showing their domains: DysF – Dysferlin, AIR – ATG5-interacting region, and PH – Pleckstrin homology domain. Alignment of the AIR domain amino acid sequence of human TECPR1 and the zebfafish orthologs, Tecpr1a and Tecpr1b, is shown between the schematics. Symbols denote: (*) identical residues, (:) conserved substitutions, and (.) semiconserved substitutions. (C) Gene expression of adult zebrafish leukocytes determined using the zebrafish blood atlas [48]. Each dot represents a separate scRnaseq sample (cell); replicates were performed across multiple zebrafish wild-type and transgenic strains. Each arm of the schematic represents a separate blood cell population (labeled). Deeper color indicates higher expression (log10 scale bars described for each gene). (D) Representative confocal images of control, tecpr1a, tecpr1b and tecpr1a tecpr1b double knockdown CMV:GFP-Lc3 larvae infected systemically with approximately 1600 CFU of mKate2-labeled D39 δcps S. pneumoniae fixed at 2 hpi. (E) Quantification of Lc3 associations with intracellular S. pneumoniae within infected phagocytes of fixed tecpr1a, tecpr1b and tecpr1a tecpr1b double knockdown CMV:GFP-Lc3 larvae. Data are shown as mean ± standard deviation (SD). n ≥ 17 zebrafish larvae were analyzed. (F) representative confocal images of control or tecpr1a knockdown CMV:GFP-Lc3 larvae infected systemically with approximately 1600 CFU of mKate2-labeled ply-positive (D39 Δcps) or ply-negative (D39 Δcps Δply) S. pneumoniae fixed at 2 hpi. (G) Quantification of Lc3 associations with intracellular ply-positive or ply-negative S. pneumoniae within infected phagocytes of control or tecpr1a knockdown CMV:GFP-Lc3 larvae fixed at 2 hpi. Data are shown as mean ± standard deviation (SD). Data obtained from two independent experiments. (H) Numbers of viable colony forming units (CFUs) over time of control and tecpr1a knockdown larvae. Data obtained from two independent experiments.

Both LAP and STIL are evoked in response to S. pneumoniae. (A) Representative confocal images of control, cyba, tecpr1a and cyba tecpr1a double knockdown CMV:GFP-Lc3 larvae infected systemically with approximately 1600 CFU of mKate2-labeled D39 δcps S. pneumoniae fixed at 2 hpi. (B) Quantification of Lc3 associations with intracellular S. pneumoniae within infected phagocytes of fixed cyba, tecpr1a and cyba tecpr1a double knockdown CMV:GFP-Lc3 larvae. Data are shown as mean ± standard deviation (SD). Data obtained from two independent experiments. (C) Numbers of viable colony forming units (CFUs) over time of control, cyba, tecpr1a and cyba tecpr1a double knockdown larvae. Data obtained from two independent experiments.

Involvement of ROS-independent LAP-like CASM of S. pneumoniae-containing vesicles. (A) Representative confocal images of control, tecpr1a cyba double knockdown or atg16l1 tecpr1a cyba triple knockdown CMV:GFP-Lc3 larvae infected systemically with approximately 1600 CFU of Ply-positive (D39 Δcps) and Ply-negative (D39 Δcps Δply) mKate2-labeled S. pneumoniae at 2 hpi. (B) Quantification of Lc3 associations with intracellular PLY-positive or PLY-negative S. pneumoniae within infected phagocytes of control, tecpr1a cyba double knockdown or atg16l1 tecpr1a cyba triple knockdown CMV:GFP-Lc3 larvae. Data are shown as mean ± standard deviation (SD). Data obtained from two independent experiments.

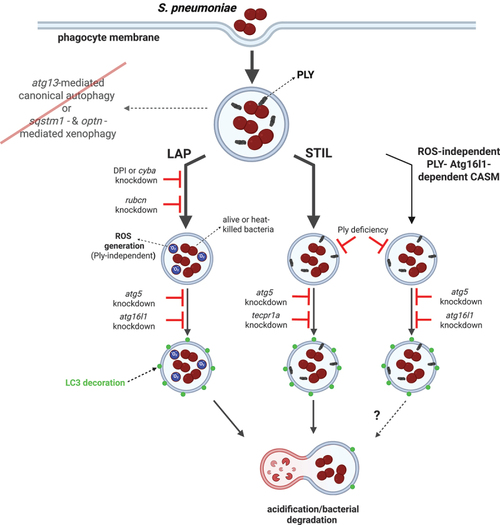
Model of autophagic response to pneumococci within zebrafish macrophages. After internalization by phagocytes, pneumococci are sequestered within Lc3-decorated vacuoles which are formed by three independent mechanisms: ROS-dependent LAP or two ROS-independent Ply-mediated pathways including STIL. LAP occurs as a result of osmotic imbalance within bacteria-containing phagosome caused by ROS production by NADPH oxidase. In contrast, STIL is induced upon membrane perturbation caused by secretion of bacterial pneumolysin manifested by sphingomyelin presence on the outside leaflet of the phagosome. STIL is dependent on Tecpr1a which recognizes sphingomyelin and mediates Lc3 lipidation. Last, the Atg16l1- and Ply-dependent pathway contributes to the smallest portion of Lc3 lipidation. However, the specific mechanisms controlling this process remain to be revealed. Following Lc3-assisted vacuolar sequestration, pneumococci are more efficiently targeted for lysosomal degradation and the Lc3 decoration is removed. The classical xenophagy receptors (sqstm1 and optineurin) as well as the canonical autophagy initiation molecule (atg13) are dispensable in this model. Despite the absence of these xenophagy-mediating factors, the bacteria are efficiently degraded. Figure created with BioRender.

Acknowledgments
This image is the copyrighted work of the attributed author or publisher, and ZFIN has permission only to display this image to its users. Additional permissions should be obtained from the applicable author or publisher of the image. Full text @ Autophagy