IMAGE

Figure 4.

ID
ZDB-IMAGE-260105-105
Source
Figures for Michno et al., 2025
Image
Figure Caption

Figure 4.

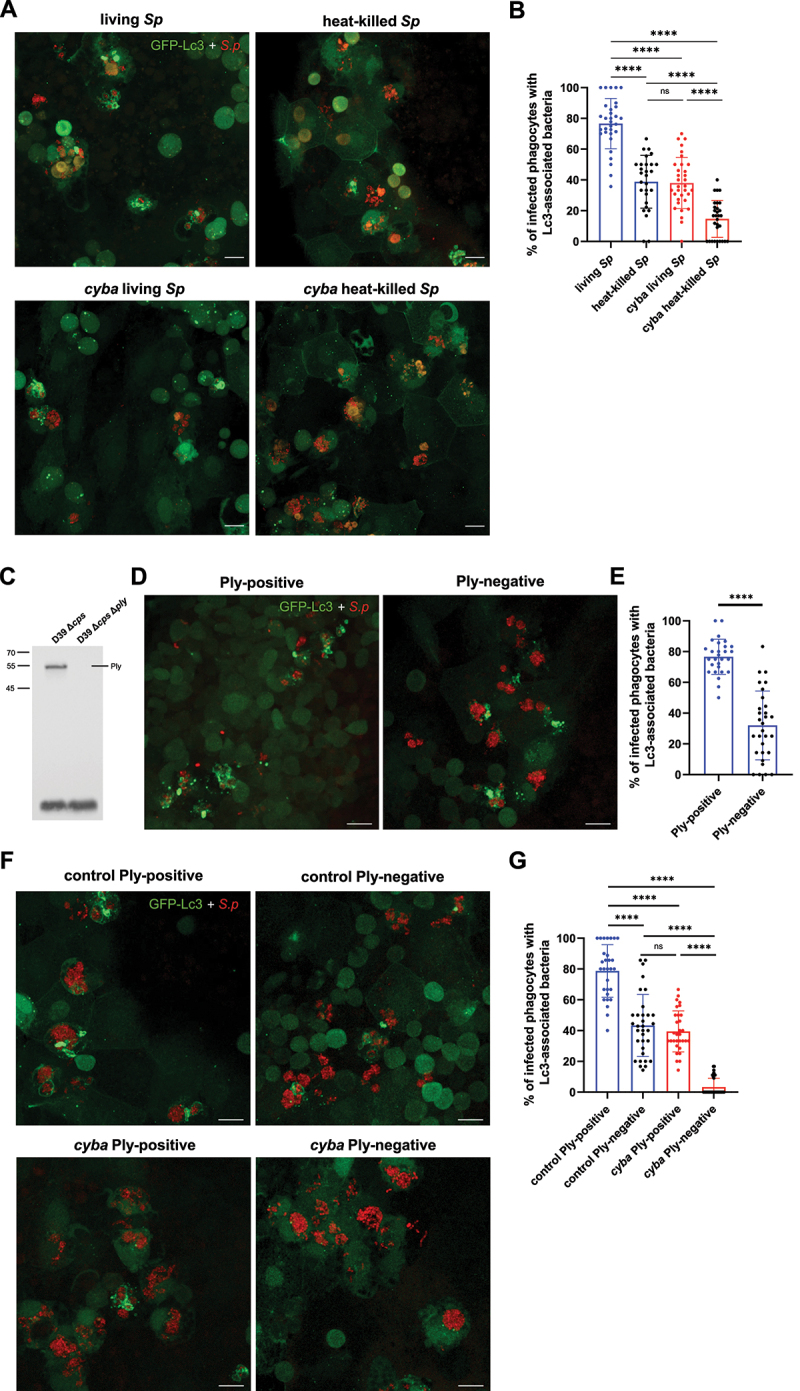
Live and pnemolysin-positive pneumococci are required to fully induce Lc3-mediated response within zebrafish macrophages. (A) Representative confocal images of CMV:GFP-Lc3 control (top two panels) or cyba knockdown (bottom two panels) larvae infected systemically with approximately 1600 CFU of live (left two panels) and heat-killed (right two panels) mKate2-labeled D39 Δcps S. pneumoniae fixed at 2 hpi. Scale bars: 10 µm. (B) Quantification of Lc3 associations with intracellular live or heat-killed S. pneumoniae within infected phagocytes of fixed CMV:GFP-Lc3 control or cyba larvae at 2 hpi. Data are shown as mean ± standard deviation (SD). Data obtained from two independent experiments. (C) Anti-Ply immunoblot analysis of whole-cell lysates from the indicated S. pneumoniae strains. The position of protein markers are indicated in kiloDaltons, Pneumolysin (Ply) ≈ 53.7 KDa. Representative blot shown, n = 4. (D) Representative confocal images of control CMV:GFP-Lc3 larvae infected systemically with approximately 1600 CFU of Ply-positive (D39 Δcps, left panel) and Ply-negative (D39 Δcps Δply, right panel) mKate2-labeled S. pneumoniae fixed at 2 hpi. Scale bars: 10 µm. (E) Quantification of Lc3 associations with intracellular Ply-positive or Ply-negative S. pneumoniae within infected phagocytes of fixed CMV:GFP-Lc3 larvae at 2 hpi. Data are shown as mean ± standard deviation (SD). Data obtained from two independent experiments. (F) Representative confocal images of CMV:GFP-Lc3 control (top two panels) or cyba knockdown (bottom two panels) larvae infected systemically with approximately 1600 CFU of Ply-positive (D39 Δcps, left two panels) and Ply-negative (D39 Δcps Δply, right two panels) mKate2-labeled S. pneumoniae fixed at 2 hpi. Scale bars: 10 µm. (G) Quantification of Lc3 associations with intracellular Ply-positive or Ply-negative S. pneumoniae within infected phagocytes of fixed CMV:GFP-Lc3 control or cyba larvae at 2 hpi. Data are shown as mean ± standard deviation (SD). Data obtained from two independent experiments.

Acknowledgments
This image is the copyrighted work of the attributed author or publisher, and ZFIN has permission only to display this image to its users. Additional permissions should be obtained from the applicable author or publisher of the image. Full text @ Autophagy