FIGURE

Figure 2.

ID
ZDB-FIG-260105-104
Publication
Michno et al., 2025 - Pneumolysin-dependent and independent non-canonical autophagy processes mediate host defense against pneumococcal infection
Other Figures
All Figure Page
Back to All Figure Page
Figure 2.

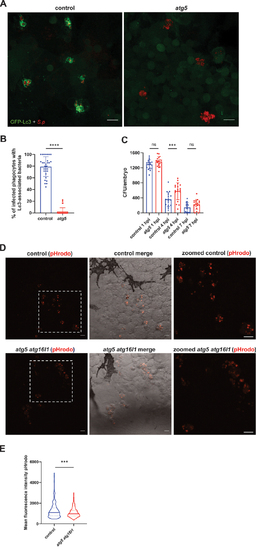
The autophagic response contributes to phagosomal acidification and pneumococcal clearance. (A) Representative confocal images of control (left panel) and atg5 knockdown (right panel) CMV:GFP-Lc3 larvae infected systemically with approximately 1600 CFU of mKate2-labeled D39 Δcps S. pneumoniae and fixed at 2 hpi. Scale bars: 10 µm. (B) Quantification of Lc3 associations with intracellular bacteria of control and atg5 knockdown larvae. Data are shown as individual values ± standard deviation (SD). Data obtained from two independent experiments. (C) Numbers of viable colony forming units (CFUs) control or atg5 knockdown larvae infected intravenously with approximately 1600 CFU of S. pneumoniae monitored at 1, 4, and 7 hpi. Data obtained from two independent experiments (D) Representative in vivo images of circulation valley of control (top) and atg5 atg16l1 knockdown larvae (bottom) at 2 hpi injected with S. pneumoniae D39 ∆cps prestained with pHrodo Red. Panels on the right represent zoomed-in areas (indicated by dashed squares). Scale bars represent 10 µm. (E) Quantification of pHrodo Red fluorescence intensity within phagocytes containing pneumococci. Data obtained from two independent experiments). **** - p < 0.0001, *** - p < 0.001, ns – not significant.

Expression Data

Expression Detail
Antibody Labeling
Phenotype Data

Phenotype Detail
Acknowledgments
This image is the copyrighted work of the attributed author or publisher, and ZFIN has permission only to display this image to its users. Additional permissions should be obtained from the applicable author or publisher of the image. Full text @ Autophagy