
- Title
-
Combined antiresorptive and new anabolic drug approach in osteogenesis imperfecta zebrafish models
- Authors
- Masiero, C., Tonelli, F., Aresi, C., Filibian, M., Larionova, D., Cotti, S., Doria, F., Torriani, C., Bertuccio, P., Odone, A., Villani, S., Rossi, A., Witten, P.E., Forlino, A.
- Source
- Full text @ JBMR Plus
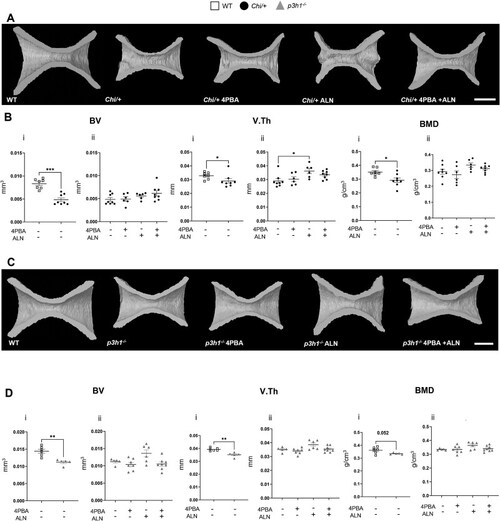
Bone geometrical parameters. (A) Representative 3-dimensional (3D) models of WT and untreated and treated PHENOTYPE:
|
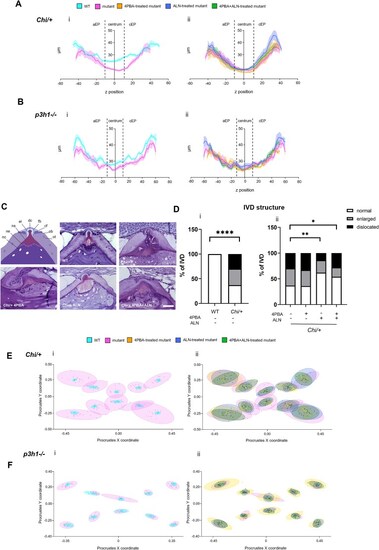
Two-dimensional (2D) analysis of vertebral thickness and intervertebral disk (IVD) structure in PHENOTYPE:
|
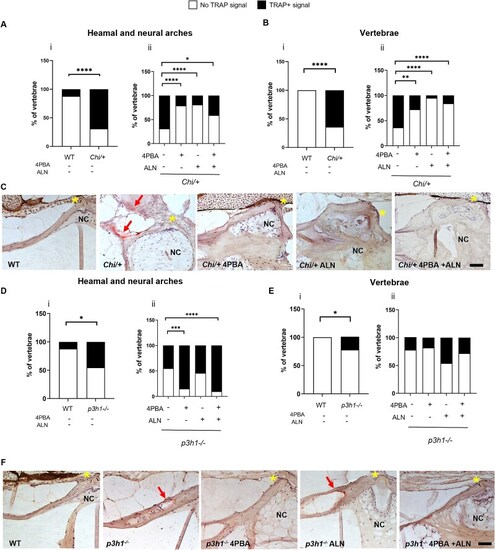
Analysis of osteoclast activity in PHENOTYPE:
|
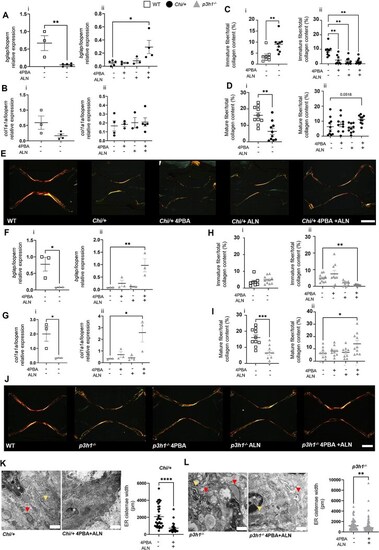
Analysis of osteoblast homeostasis and extracellular collagen maturation. (A) RT-qPCR analysis of |
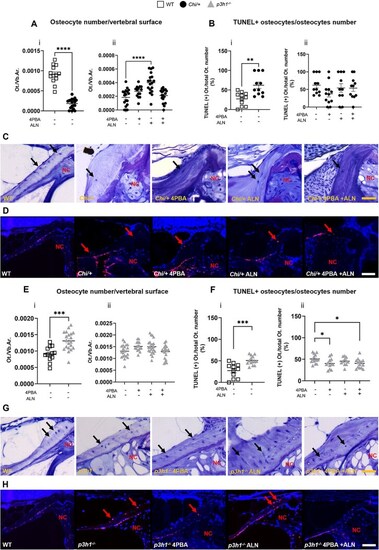
Analysis of osteocyte number and viability in PHENOTYPE:
|