IMAGE

Figure 5

ID
ZDB-IMAGE-250826-37
Source
Figures for Masiero et al., 2025
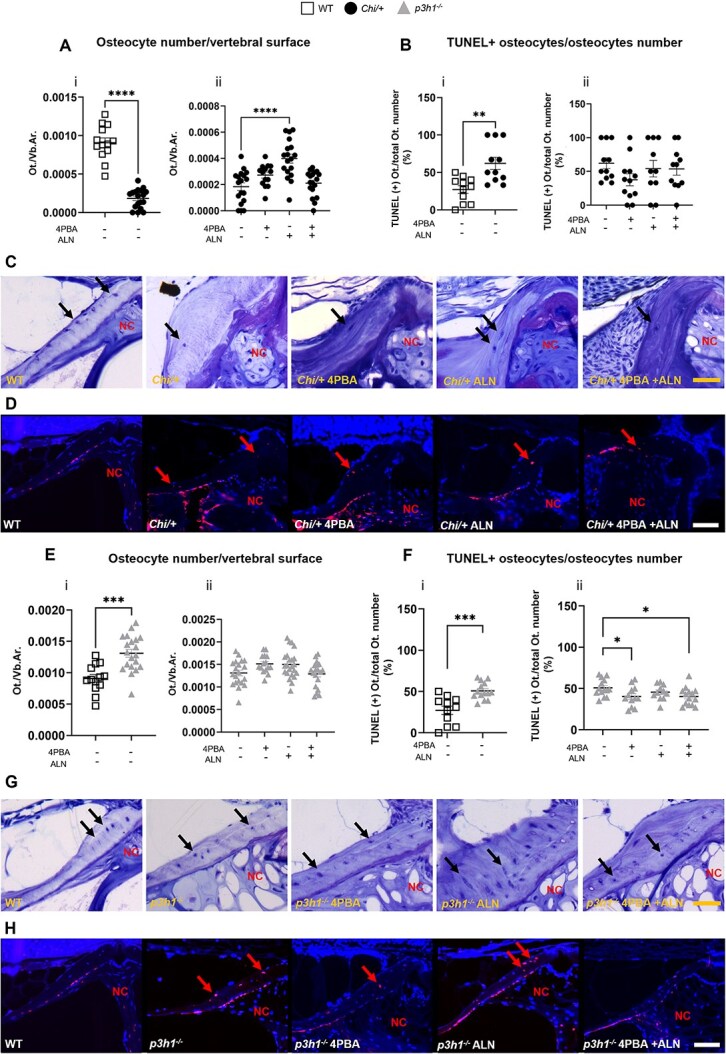
Image
Figure Caption

Figure 5

Analysis of osteocyte number and viability in Chi/+ and p3h1−/−. (A) Osteocyte number normalized to vertebral area (Ot./vb.Ar.) performed on toluidine blue sections of WT, Chi/+ (i), and untreated and treated Chi/+ (ii). (B) TUNEL+ osteocytes on total osteocytes number (TUNEL(+) Ot./ total Ot. number) in WT, Chi/+ (i), and untreated and treated Chi/+ (ii). (C) Representative images of toluidine blue–stained vertebrae showing osteocytes (black arrows) in WT and untreated or treated Chi/+. Scale bar: 50 μm. (D) Representative images of TUNEL assay performed on WT and treated and untreated Chi/+ vertebrae. Red arrows indicate apoptotic osteocytes; nuclei are stained with DAPI (4′,6-diamidino-2-phenylindole). Scale bar: 100 μm. (E) Osteocyte number on vertebral area (Ot./vb.Ar.) performed on toluidine blue–stained sections of WT, p3h1−/− (i), and untreated and treated p3h1−/ (ii). (F) TUNEL+ osteocytes on total osteocyte number (TUNEL(+) Ot./ total Ot. Number) in WT p3h1−/− (i) and untreated and treated p3h1−/− (ii). (G) Representative images of toluidine blue–stained vertebrae showing osteocytes (black arrows) in WT and untreated or treated p3h1−/−. Scale bar: 50 μm. (H) Representative images of TUNEL assay performed on WT and treated and untreated p3h1−/− vertebrae. Red arrows indicate apoptotic osteocytes; nuclei are stained with DAPI. Scale bar: 100 μm. In the graphs, each dot represents a single value. *p < .05, **p < .01, ***p < .001, ****p < .0001. Abbreviations: ALN, alendronate; NC, notochord; 4PBA, 4-phenylbutyrate.

Figure Data
Acknowledgments
This image is the copyrighted work of the attributed author or publisher, and ZFIN has permission only to display this image to its users. Additional permissions should be obtained from the applicable author or publisher of the image. Full text @ JBMR Plus