FIGURE

Figure 3

ID
ZDB-FIG-250826-33
Publication
Masiero et al., 2025 - Combined antiresorptive and new anabolic drug approach in osteogenesis imperfecta zebrafish models
Other Figures
All Figure Page
Back to All Figure Page
Figure 3

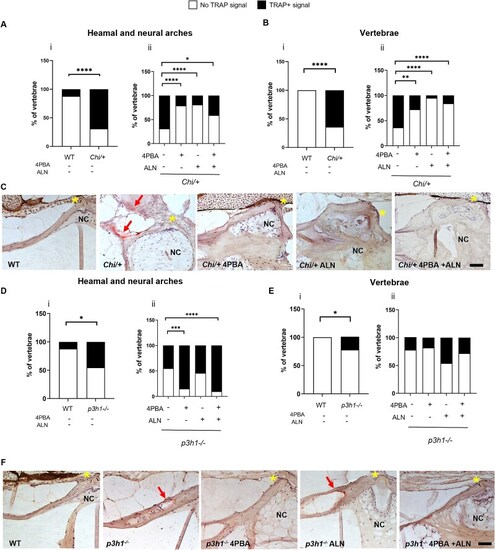
Analysis of osteoclast activity in Chi/+ and p3h1−/− zebrafish. (A, B) TRAP staining quantification on haemal and neural arches and autocentrum of WT and Chi/+ (i) and Chi/+ untreated and treated with 4PBA, ALN, and 4PBA + ALN (ii). (C) Representative images of TRAP-stained WT and Chi/+ caudal vertebrae. (D, E) TRAP staining quantification on arches and vertebrae of WT and p3h1−/− (i) and p3h1−/− untreated and treated with 4PBA, ALN, and 4PBA + ALN (ii). (F) Representative images of TRAP-stained WT and p3h1−/− caudal vertebrae. Red arrows indicate TRAP signal on vertebral bodies. The yellow asterisks indicate the intervertebral disc. Scale bar: 50 μm. In the graphs, the percentage of TRAP+ vertebrae on total number of analyzed vertebrae is reported. *p < .05, **p < .01, ***p < .001, ****p < .0001. Abbreviations: ALN, alendronate; NC, notochord; TRAP, tartrate-resistant acid phosphatase; 4PBA, 4-phenylbutyrate.

Expression Data

Expression Detail
Antibody Labeling
Phenotype Data
Fish:
Conditions:
Observed In:
Stage: Adult

Phenotype Detail
Acknowledgments
This image is the copyrighted work of the attributed author or publisher, and ZFIN has permission only to display this image to its users. Additional permissions should be obtained from the applicable author or publisher of the image. Full text @ JBMR Plus