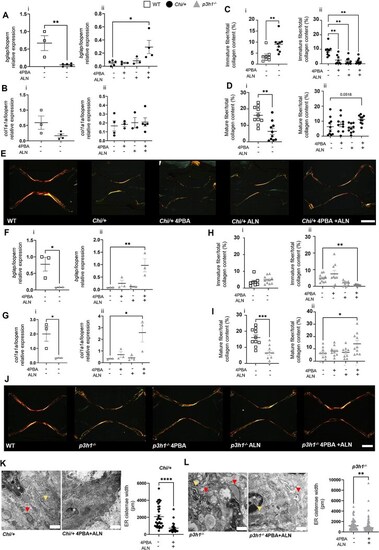
Analysis of osteoblast homeostasis and extracellular collagen maturation. (A) RT-qPCR analysis of bglap expression in WT, Chi/+ (i), and untreated and treated Chi/+ (ii). (B) RT-qPCR analysis of col1a1a expression in WT, Chi/+, and untreated and treated Chi/+. (C, D) Quantification of the immature (green-yellow) or mature (red) collagen fibers on total collagen content in WT, Chi/+ (i) and untreated and treated Chi/+ (ii) caudal vertebrae. (E) Representative images of picrosirius red–stained caudal vertebrae sections of WT and untreated or treated Chi/+. Scale bar: 100 μm. (F) RT-qPCR analysis of bglap expression in WT, p3h1−/− (i), and untreated and treated p3h1−/− (ii). (G) RT-qPCR analysis of col1a1a expression in WT, p3h1−/− (i), and untreated and treated p3h1−/− (ii). (H, I) Quantification of the immature (green-yellow) or mature (red) collagen fibers on total collagen content in WT, p3h1−/− (i), and untreated and treated p3h1−/− caudal vertebrae (ii). (J) Representative images of picrosirius red–stained caudal vertebrae sections of WT and untreated and treated p3h1−/−. Scale bar: 100 μm. (K) Transmission electron microscopy representative images of Chi/+ osteoblasts and quantification of ER cisternae width in Chi/+ and Chi/+ treated with 4PBA + ALN. Scale bar = 500 nm. (L) Transmission electron microscopy representative images of p3h1−/− osteoblasts and quantification of ER cisternae width in p3h1−/− and p3h1−/− treated with 4PBA + ALN. Scale bar = 500 nm. (Red arrowheads indicate ER cisternae transverse sections, yellow arrowheads indicate ER cisternae sagittal sections, pink asterisks indicate osteoblasts nuclei.). *p < .05, **p < .01, ***p < .001, ****p < .0001. Abbreviations: ALN, alendronate; ER, endoplasmic reticulum; RT-qPCR, reverse transcriptase quantitative PCR; 4PBA, 4-phenylbutyrate.
|
