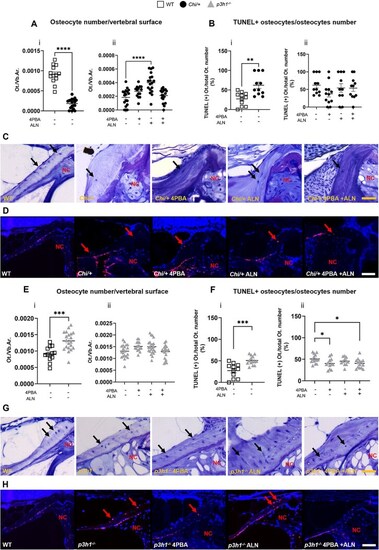
Analysis of osteocyte number and viability in Chi/+ and p3h1−/−. (A) Osteocyte number normalized to vertebral area (Ot./vb.Ar.) performed on toluidine blue sections of WT, Chi/+ (i), and untreated and treated Chi/+ (ii). (B) TUNEL+ osteocytes on total osteocytes number (TUNEL(+) Ot./ total Ot. number) in WT, Chi/+ (i), and untreated and treated Chi/+ (ii). (C) Representative images of toluidine blue–stained vertebrae showing osteocytes (black arrows) in WT and untreated or treated Chi/+. Scale bar: 50 μm. (D) Representative images of TUNEL assay performed on WT and treated and untreated Chi/+ vertebrae. Red arrows indicate apoptotic osteocytes; nuclei are stained with DAPI (4′,6-diamidino-2-phenylindole). Scale bar: 100 μm. (E) Osteocyte number on vertebral area (Ot./vb.Ar.) performed on toluidine blue–stained sections of WT, p3h1−/− (i), and untreated and treated p3h1−/ (ii). (F) TUNEL+ osteocytes on total osteocyte number (TUNEL(+) Ot./ total Ot. Number) in WT p3h1−/− (i) and untreated and treated p3h1−/− (ii). (G) Representative images of toluidine blue–stained vertebrae showing osteocytes (black arrows) in WT and untreated or treated p3h1−/−. Scale bar: 50 μm. (H) Representative images of TUNEL assay performed on WT and treated and untreated p3h1−/− vertebrae. Red arrows indicate apoptotic osteocytes; nuclei are stained with DAPI. Scale bar: 100 μm. In the graphs, each dot represents a single value. *p < .05, **p < .01, ***p < .001, ****p < .0001. Abbreviations: ALN, alendronate; NC, notochord; 4PBA, 4-phenylbutyrate.
|
