FIGURE SUMMARY
Title

Biocompatible exosomes derived from Pinctada martensii mucus for therapeutic melanin regulation via α-MSH/NF-κB/MITF pathway

Authors
Mo, D., Zheng, W., Gao, Z., Ma, K., Yang, K., Zeng, T., Qin, C., Luo, Y., Zheng, L., Xu, S.
Source
Full text @ Regen Biomater

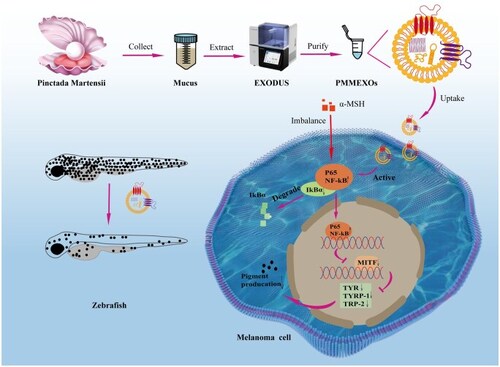
Exosomes derived from Pinctada martensii mucus (PMMEXOs) inhibit melanin production by activating the NF-κB signaling pathway.

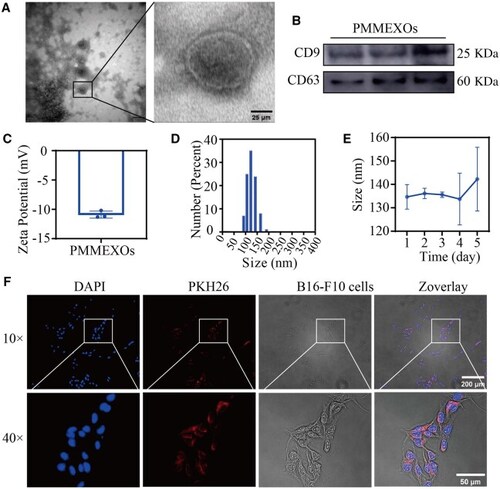
Characterization of PMMEXOs. (A) Morphology of PMMEXOs, observed by transmission electron microscopy (TEM). Scale bars = 25 μm. (B) Western blot analysis of EV biomarkers in PMMEXOs, including CD63 and CD9. (C) DLS represents the particle zeta of PMMEXOs. (D) DLS indicates the particle size of PMMEXOs. (E) Storage stability: PMMEXOs was stored at pH7.4 PBS, −80°C for 5 days and the particle size was determined. (F) The absorption of PMMEXOs by B16-F10 cells was observed by micrograph (magnification: 10 ×, scale bars = 200 μm) and magnification (magnification: 40 ×, scale bars = 50 μm). After incubation for 24 h, fluorescent PKH26-labeled PMMEXOs, nuclei stained with DAPI. n = 3.

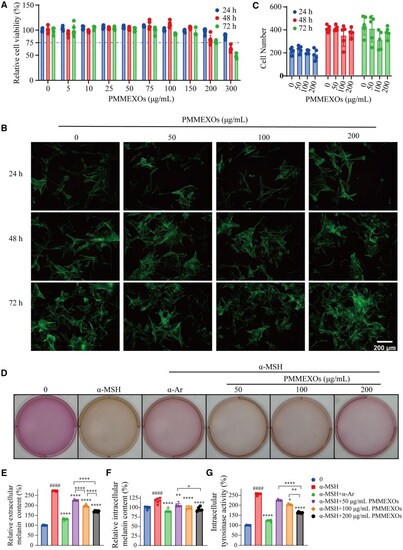
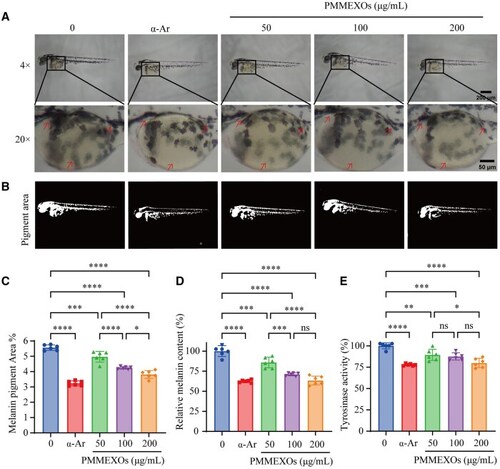
Effects of PMMEXOs on melanin secretion and tyrosinase activity in B16F10 melanoma cells. (A) PMMEXOs (0–300 μg/mL) treated B16F10 cells at 24 h, 48 h, 72 h relative cell viability, n = 6. (B) Microscopic images were collected every 24 h. Scale bars = 200 μm, n = 3. (C) Number of cells per 24 h, n = 5. (D) Change in medium colour after each well of drug treatment. Intracellular (E) and extracellular (F) measurements of melanin content, n = 6. (G) Evaluation of tyrosinase activity after PMMEXOs treatment, n = 6. Data were expressed as mean ± SD, and one-way analysis of variance was used for statistical significance. *P < 0.05, **P < 0.01, ***P < 0.001, ****P < 0.0001 compared with α-MSH model group, ####P < 0.0001 compared with the blank group.

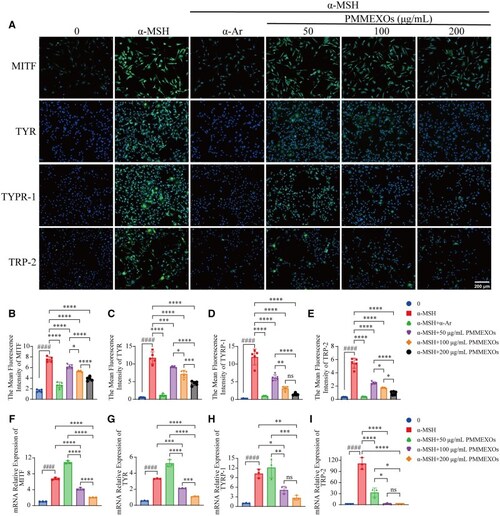
PMMEXOs inhibits the expression of melanin-related proteins and genes. (A) Immunofluorescence staining of MITF, TYR, TYRP-1 and TRP-2 proteins during melanin production. After incubation for 24 h, fluorescent of MITF, TYR, TYRP-1 and TRP-2 proteins, nuclei stained with DAPI. Scale bars = 200 μm. Quantitative fluorescence intensity analysis of MITF (B), TYR (C), TYRP-1 (D), TRP-2 (E) proteins. n = 5. The mRNA expression levels of MITF (F), TYR (G), TYRP-1 (H) and TRP-2 (I) in PMMEXOs treated cells were detected by RT-qPCR (n = 3). Data were expressed as mean ± SD, and one-way analysis of variance was used for statistical significance. n. s. no significant difference observed between groups. *P < 0.05, **P < 0.01, ***P < 0.001, ****P < 0.0001 compared with α-MSH model group, ####P < 0.0001 compared with the blank group.

In vivo effects of PMMEXOs on inhibiting melanin production in zebrafish embryos. (A) Micrograph (magnification: 4×, scale bars = 200 μm) and magnification (magnification: 20×, scale bars = 50 μm) of juvenile zebrafish pigmentation. The arrows indicate melanin pigment. (B) ImageJ software for analysis of melanin deposits in zebrafish embryos. (C) Quantitative analysis of the relative melanin deposition area. (D) Relative melanin content in juvenile zebrafish. (E) tyrosinase activity in zebrafish juveniles. n = 6. Data were expressed as mean ± SD, and one-way analysis of variance was used for statistical significance. n. s. no significant difference observed between groups. *P < 0.05, **P < 0.01, ***P < 0.001, ****P < 0.0001 compared with α-MSH model group, ####P < 0.0001 compared with the blank group.

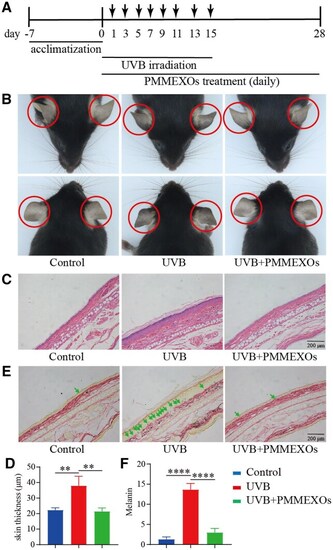
The effect of PMMEXOs on excessive pigmentation of the ear skin in C57BL/6 mice induced by UVB irradiation. (A) Time graph of the mouse experimental procedure. (B) Representative images of pigmentation on the skin of mouse ears. The circles indicate the areas irradiated by UVB. (C) Representative images of HE staining of mouse ear skin tissue. Scale bars =200 μm. (D) Statistical analysis of the corresponding epidermal thickness of the ear skin. (E) Representative images of Fontana–Masson staining of mouse ear skin tissue. The melanin pigment indicated by the arrow. Scale bars =200 μm. (F) Statistical analysis of the corresponding melanin content. n = 3, data are expressed as mean ± SD, one-way analysis of variance was used for statistical significance. **P < 0. 01, ****P < 0.0001.

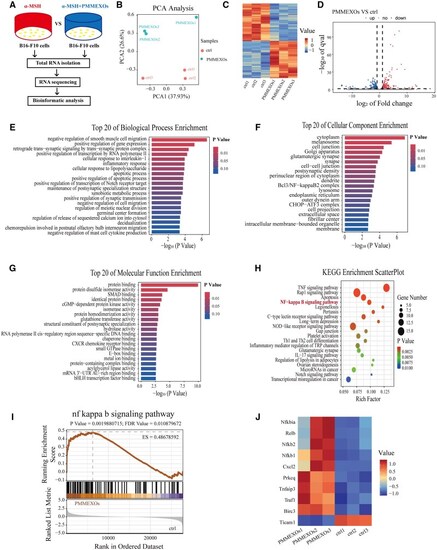
Analysis of RNA sequencing results and enrichment of differentially expressed genes. (A) Schematic of the RNA sequencing analysis of B16-F10 cells. (B) PCA analysis of two samples (C) Differential expression gene cluster heat maps for each sample. (D) Volcanic maps showing DEGs. The top 20 significantly enriched in GO terms, including biological processes (E), cell composition (F) and molecular function (G). (H) The top 20 significantly enriched KEGG pathways. (I) Enrichment map of NF-kappa B signaling pathway (nominal P < 0.05, FDR < 0.01, NES = 1.7455872). (J) Heat maps of gene aggregation in NF-κB signaling pathways.

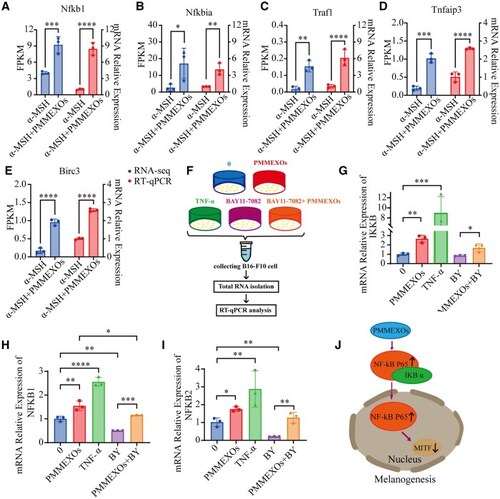
RT-qPCR validated transcriptome sequencing data. Confirmation of transcriptome sequencing data by RT-PCR, including Nfkb1 (A), Nfkbia (B), Traf1 (C), Tnfaip3 (D), Birc3 (E). (F) A brief diagram of RT-PCR experiments performed on B16-F10 cells treated with different groups. mRNA levels of IKKb (G), NFkB1 (H) and NFkB2 (I) in the NF-κB signaling pathway were detected by RT-PCR. (J) Schematic diagram of PMMEXOs inhibiting melanin production. n = 3, data are expressed as mean ± SD, one-way analysis of variance was used for statistical significance. *P < 0.05, **P < 0. 01, ***P < 0.001, ****P < 0.0001.

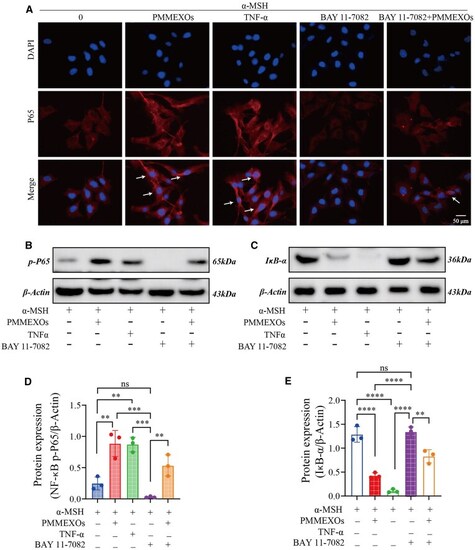
PMMEXOs reduces melanin production by activating the NF-κB signaling pathway. (A) The translocation of NF-κB p-65 from cytoplasm to nucleus of B16-F10 cells after different drug stimulation was detected by immunofluorescence assay. The arrow indicates the translocation of NF-κB p-65 from cytoplasm to nucleus. Fluorescent of NF-κB p-65 proteins, nuclei stained with DAPI. Scale bars = 50 μm. WB detection of NF-κB p-P65 (B) and IκB-α (C) protein expression. The relative protein expression level of NF-κB p-P65 (D) and IκB-α (E) were quantitatively analyzed. n = 3. Data are expressed as mean ± SD, one-way analysis of variance was used for statistical significance. n. s. no significant difference observed between groups. *P < 0.05, **P < 0. 01, ***P < 0.001, ****P < 0.0001.

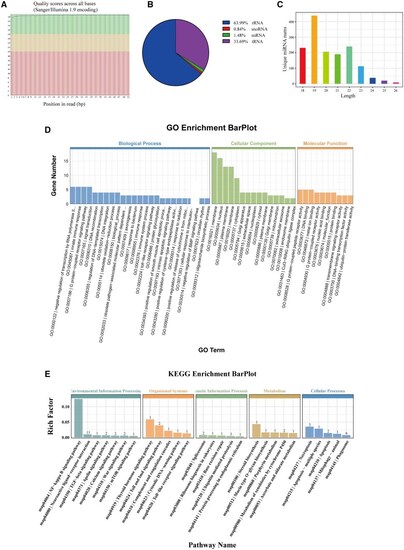
miRNA-Seq analysis of PMMEXOs. (A) Quality analysis results of RNA extracted from PMMEXOs. (B) All mapped clean reads are annotated and the percentage is calculated. (C) Length distribution of identified miRNAs. The GO (D) and KEGG (E) enrichment barplot of the predicted target genes for the highly expressed miRNAs in PMMEXOs.

Acknowledgments
This image is the copyrighted work of the attributed author or publisher, and ZFIN has permission only to display this image to its users. Additional permissions should be obtained from the applicable author or publisher of the image. Full text @ Regen Biomater