IMAGE

Figure 7.

ID
ZDB-IMAGE-250801-99
Source
Figures for Mo et al., 2025
Image
Figure Caption

Figure 7.

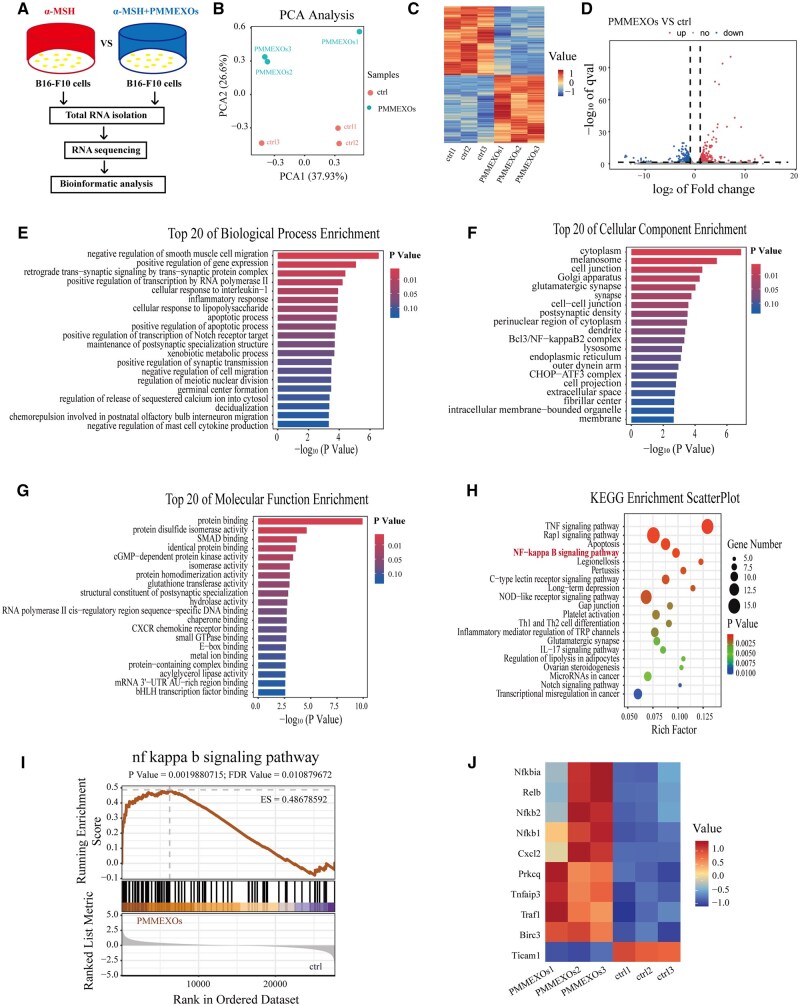
Analysis of RNA sequencing results and enrichment of differentially expressed genes. (A) Schematic of the RNA sequencing analysis of B16-F10 cells. (B) PCA analysis of two samples (C) Differential expression gene cluster heat maps for each sample. (D) Volcanic maps showing DEGs. The top 20 significantly enriched in GO terms, including biological processes (E), cell composition (F) and molecular function (G). (H) The top 20 significantly enriched KEGG pathways. (I) Enrichment map of NF-kappa B signaling pathway (nominal P < 0.05, FDR < 0.01, NES = 1.7455872). (J) Heat maps of gene aggregation in NF-κB signaling pathways.

Acknowledgments
This image is the copyrighted work of the attributed author or publisher, and ZFIN has permission only to display this image to its users. Additional permissions should be obtained from the applicable author or publisher of the image. Full text @ Regen Biomater