IMAGE

Figure 5.

ID
ZDB-IMAGE-250801-97
Source
Figures for Mo et al., 2025
Image
Figure Caption

Figure 5.

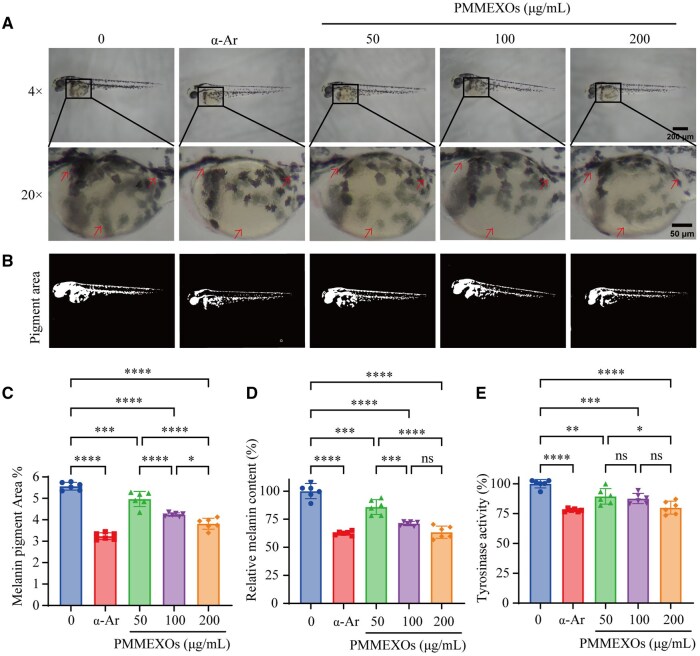
In vivo effects of PMMEXOs on inhibiting melanin production in zebrafish embryos. (A) Micrograph (magnification: 4×, scale bars = 200 μm) and magnification (magnification: 20×, scale bars = 50 μm) of juvenile zebrafish pigmentation. The arrows indicate melanin pigment. (B) ImageJ software for analysis of melanin deposits in zebrafish embryos. (C) Quantitative analysis of the relative melanin deposition area. (D) Relative melanin content in juvenile zebrafish. (E) tyrosinase activity in zebrafish juveniles. n = 6. Data were expressed as mean ± SD, and one-way analysis of variance was used for statistical significance. n. s. no significant difference observed between groups. *P < 0.05, **P < 0.01, ***P < 0.001, ****P < 0.0001 compared with α-MSH model group, ####P < 0.0001 compared with the blank group.

Acknowledgments
This image is the copyrighted work of the attributed author or publisher, and ZFIN has permission only to display this image to its users. Additional permissions should be obtained from the applicable author or publisher of the image. Full text @ Regen Biomater