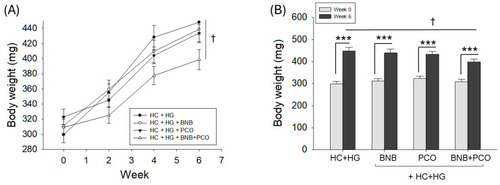
Effect of dietary intake of banaba (BNB, 0.1% w/w), policosanol (PCO, 0.1% w/w), and mixture of the banaba and policosanol (BNB+PCO, each 0.1% w/w) supplemented with high cholesterol (HC, 4% w/w) and high galactose (HG, 30% w/w) diet on the body weight of zebrafish. (A) Body weight changes over time (0–6 weeks), and (B) week 0 and week 6 body weights under respective dietary regimes. The highlights the significant variance at p < 0.05 vs. HC+HG group, while *** represents the statistical difference between week 0 and week 6 among the respective groups.

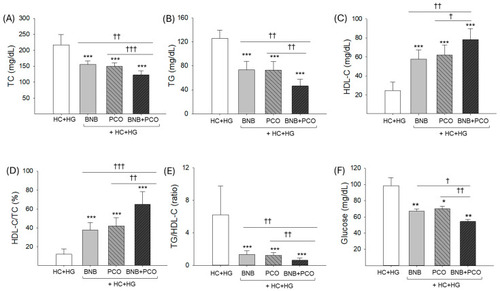
Comparison of blood lipid profile and glucose level after 6 weeks of consumption of banaba (BNB, 0.1% w/w), policosanol (PCO, 0.1% w/w), and mixture of the banaba and policosanol (BNB+PCO, each 0.1% w/w) supplemented with high cholesterol (HC, 4% w/w) and high galactose (HG, 30% w/w) diet. (A) Total cholesterol (TC), (B) triglycerides (TGs), (C) high-density lipoprotein cholesterol (HDL-C), (D) percentage ratio of HDL-C/TC, (E) ratio of TG/HDL-C, and (F) blood glucose level. The *, **, and *** underscore the statistical difference at p < 0.05, p < 0.01, and p < 0.001, respectively vs. HC+HG group. The †, ††, and ††† highlights statistical difference at p < 0.05, p < 0.01, and p < 0.001, vs. BNB+PCO.

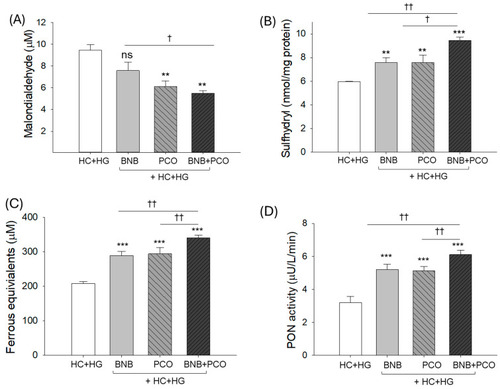
Comparison of oxidative variables and antioxidant abilities in zebrafish plasma after 6 weeks of consumption of banaba (BNB, 0.1% w/w), policosanol (PCO, 0.1% w/w) and mixture of the banaba and policosanol (BNB+PCO, each 0.1% w/w) supplemented with high cholesterol (HC, 4% w/w) and high galactose (HG, 30% w/w) diet. (A) Malondialdehyde level, (B) sulfhydryl content, (C) ferric ion reduction ability (FRA), and (D) paraoxonase (PON) activity. The ** and *** underscore the statistical difference at p < 0.01 and p < 0.001, respectively, vs. the HC+HG group. The †, †† and highlights statistical difference at p < 0.05, and p < 0.01, vs. BNB+PCO. The “ns” highlights the non-significant difference vs. HC+HG group.

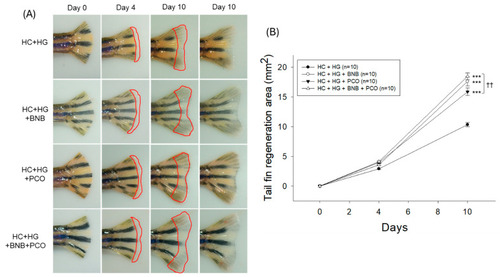
Comparison of amputated tail fin regeneration of zebrafish following consumption of banaba (BNB, 0.1% w/w), policosanol (PCO, 0.1% w/w), and mixture of the banaba and policosanol (BNB+PCO, each 0.1% w/w) supplemented with high cholesterol (HC, 4% w/w) and high galactose (HG, 30% w/w) diet. (A) Tail fin regeneration morphology during 10 days post-amputation. The regenerated tissue area is bordered by the red line. (B) Quantification of the regenerated tail fin area during 10 days post-amputation. The *** underscores the significant variance at p < 0.001 vs. group HC+HG. The †† highlights statistical difference at p < 0.01 vs. BNB+PCO.

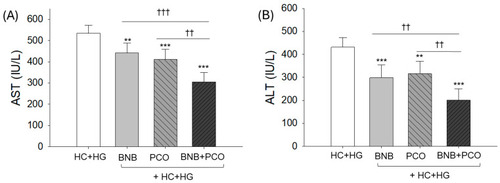
Comparison of hepatic enzymes (A) aspartate aminotransferase (AST) and (B) alanine aminotransferase (ALT) in zebrafish plasma after 6 weeks of consumption of banaba (BNB, 0.1% w/w), policosanol (PCO, 0.1% w/w) and a mixture of the banaba and policosanol (BNB+PCO, each 0.1%, w/w) supplemented with high cholesterol (HC, 4% w/w) and high galactose (HG, 30% w/w) diet. The ** and *** underscore the statistical difference at p < 0.01 and p < 0.001, respectively, vs. HC+HG group. The †† and ††† represent significant variance at p < 0.01 and p < 0.001, vs. BNB+PCO.

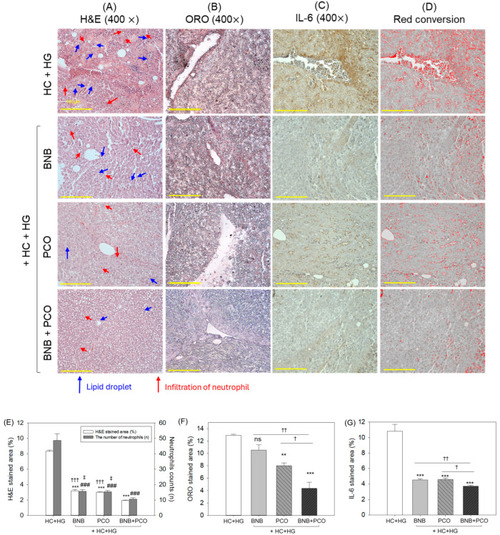
Histological analysis of hepatic tissue after 6 weeks of consumption of banaba (BNB, 0.1% w/w), policosanol (PCO, 0.1% w/w), and mixture of the banaba and policosanol (BNB+PCO, each 0.1%, w/w) supplemented with high cholesterol (HC, 4% w/w) and high galactose (HG, 30% w/w) diet. (A) Hematoxylin and eosin (H&E) staining, (B) oil red O (ORO) staining, (C) immunohistochemical analysis to detect interleukin 6 (IL-6), and (D) red conversion of the IL-6-stained area (to improve the visibility) using brown color threshold value 20–120 employing Image J software (https://imagej.net/ij, 1.53 version, accessed on 6 June 2023). (E) Quantification of H&E-stained area and neutrophil counts. (F,G) Quantification of ORO, and IL-6-stained area. The ** and *** underscore the significant variance at p < 0.01, p < 0.001 (for H&E, ORO, and IL-6-stained area), while ### underscore the statistical difference at p < 0.001 (for neutrophil counts) vs. HC+HG group. The , ††, and ††† highlight statistical differences at p < 0.05, p < 0.01, and p < 0.001 (for H&E and IL-6-stained area), while represents the statistical difference at p < 0.05 (for neutrophil counts) vs. BNB+PCO group. The “ns ” highlights the non-significant difference vs. HC+HG group.

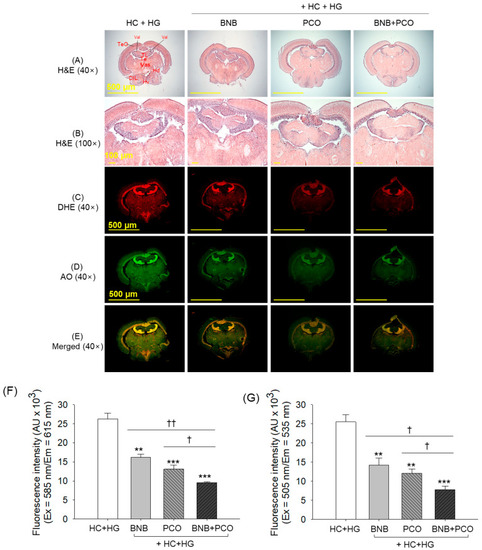
Brain histology after 6 weeks of consumption of banaba (BNB, 0.1% w/w), policosanol (PCO, 0.1% w/w), and mixture of the banaba and policosanol (BNB+PCO, each 0.1% w/w) supplemented with high cholesterol (HC, 4% w/w) and high galactose (HG, 30% w/w) diet. (A,B) Hematoxylin and eosin (H&E) staining at 40× and 100× magnification, respectively. (C) Dihydroethidium (DHE) staining. (D) Acridine orange (AO) staining and (E) merge images of DHE and AO staining. (F,G) Quantification of DHE and AO fluorescent intensities. The ** and *** underscore the significant variance at p < 0.01 and p < 0.001, vs. HC+HG group. The and †† highlight significant differences at p < 0.05 and p < 0.01, vs. BNB+PCO.

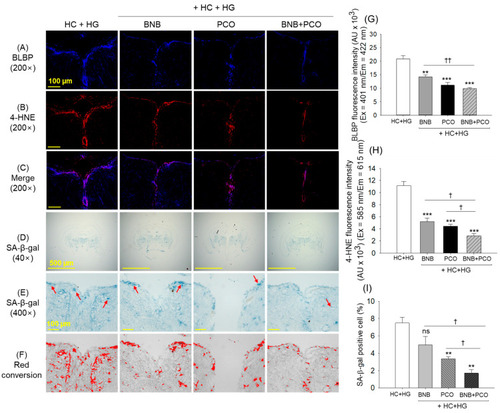
Comparison of brain lipid binding protein (BLBP), 4-hydroxynoneal (4-HNE) levels and cellular senescence in the zebrafish brain consuming banaba (BNB, 0.1% w/w), policosanol (PCO, 0.1% w/w), and mixture of the banaba and policosanol (BNB+PCO, each 0.1% w/w) amalgamated in high cholesterol (HC, 4% w/w) and high galactose (HG, 30% w/w) diet. (A,B) immunohistochemical (IHC) staining for the detection of brain lipid binding proteins (BLBPs) and lipid oxidize product 4-hydroxynoneal (4-HNE), (C) merged images obtained from BLBP and 4-HNE staining. (D,E) Senescent associated β-galactosidase (SA-β-Gal) staining at 40× and 100× magnification, respectively, the red arrow indicates senescent-positive cells, (F) red conversion of SA-β-Gal stained area (to improve the visibility) determined at blue color threshold value 0–120 employing Image J software. (G,H) Assessment of BLBP and 4-HNE fluorescent intensities, respectively. (I) Assessment of SA-β-Gal positive cells. The **, and *** underscore the significant variance at p < 0.01, and p < 0.001, vs. HC+HG group. The and †† highlight significant variance at p < 0.05 and p < 0.01 vs. BNB+PCO. The “ns” highlights the non-significant difference.

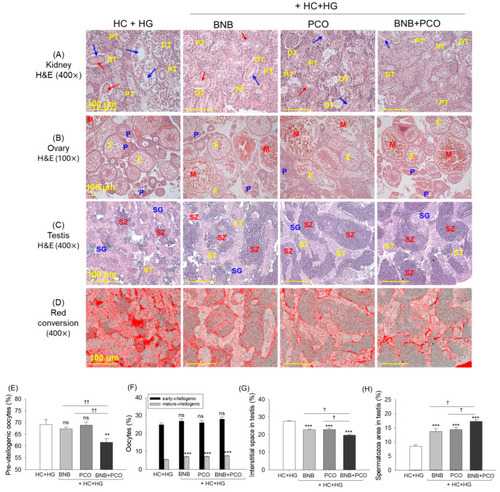
Histological analysis of kidney, ovary, and testis of zebrafish post 6 weeks of consumption of banaba (BNB, 0.1% w/w), policosanol (PCO, 0.1% w/w) and a mixture of the banaba and policosanol (BNB+PCO, each 0.1% w/w) amalgamated in high cholesterol (HC, 4% w/w) and high galactose (HG, 30% w/w) diet. (AC) Hematoxylin and eosin (H&E) staining of the kidney, ovary, and testis, respectively. Arrows blue and red depict the elevated tubular lumen and luminal debris, respectively. PT and DT are abbreviated for proximal and distal tubule, while E, P, and M depict the early, pre, and mature oocytes. In the testis section, SG, ST, and SZ are abbreviations for spermatogonia, spermatocytes, and spermatozoa, respectively. (D) Red conversion of the testicular interstitial space (to enhance the visibility) employing the Image J software at the white color threshold value 220–255. Scale bar, 100 μm. (E) Previtellogenic oocytes count in the ovary section. (F) Oocytes (early and mature) count in the testis section. (G,H) percentage quantification of interstitial space and spermatozoa count in the testis. The ** and *** underscore the statistical difference at p < 0.01 and p < 0.001 vs. HC+HG group. The and †† highlight the significant differences at p < 0.05 and p < 0.01 vs. BNB+PCO. The “ns” highlights the non-significant difference.

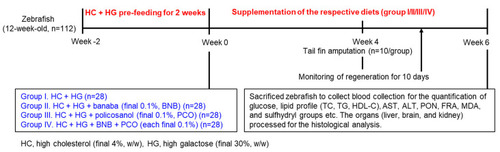
The study plan of a 6-week dietary intervention in zebrafish, incorporating a high-cholesterol (HC) and high-glucose (HG) diet infused with banaba (BNB), policosanol (PCO), or a combination of both (BNB+PCO).

Acknowledgments
This image is the copyrighted work of the attributed author or publisher, and ZFIN has permission only to display this image to its users. Additional permissions should be obtained from the applicable author or publisher of the image. Full text @ Pharmaceuticals (Basel)