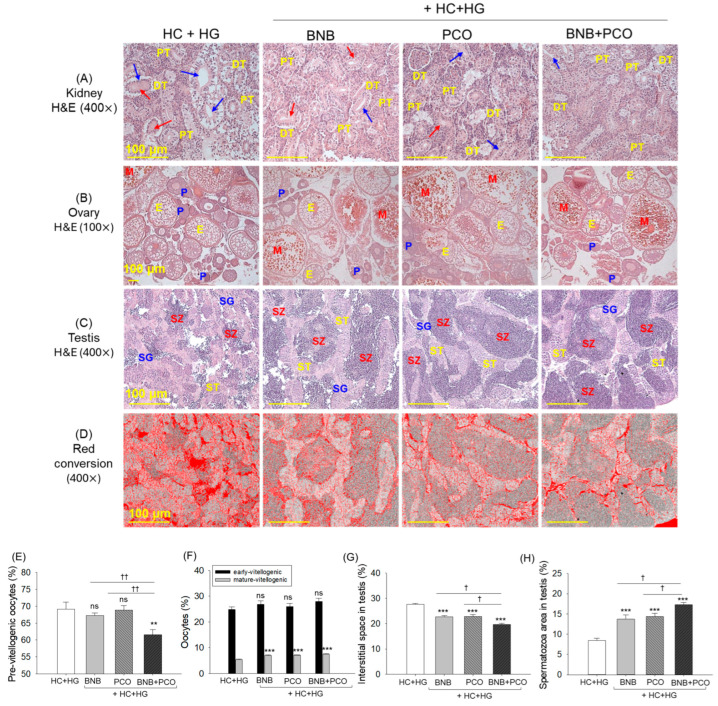
Histological analysis of kidney, ovary, and testis of zebrafish post 6 weeks of consumption of banaba (BNB, 0.1% w/w), policosanol (PCO, 0.1% w/w) and a mixture of the banaba and policosanol (BNB+PCO, each 0.1% w/w) amalgamated in high cholesterol (HC, 4% w/w) and high galactose (HG, 30% w/w) diet. (A–C) Hematoxylin and eosin (H&E) staining of the kidney, ovary, and testis, respectively. Arrows blue and red depict the elevated tubular lumen and luminal debris, respectively. PT and DT are abbreviated for proximal and distal tubule, while E, P, and M depict the early, pre, and mature oocytes. In the testis section, SG, ST, and SZ are abbreviations for spermatogonia, spermatocytes, and spermatozoa, respectively. (D) Red conversion of the testicular interstitial space (to enhance the visibility) employing the Image J software at the white color threshold value 220–255. Scale bar, 100 μm. (E) Previtellogenic oocytes count in the ovary section. (F) Oocytes (early and mature) count in the testis section. (G,H) percentage quantification of interstitial space and spermatozoa count in the testis. The ** and *** underscore the statistical difference at p < 0.01 and p < 0.001 vs. HC+HG group. The † and †† highlight the significant differences at p < 0.05 and p < 0.01 vs. BNB+PCO. The “ns” highlights the non-significant difference.
Acknowledgments
This image is the copyrighted work of the attributed author or publisher, and
ZFIN has permission only to display this image to its users.
Additional permissions should be obtained from the applicable author or publisher of the image.
Full text @ Pharmaceuticals (Basel)
Your Input Welcome
Thank you for submitting comments. Your input has been emailed to ZFIN curators who may contact you if
additional information is required.
Oops. Something went wrong. Please try again later.