IMAGE

Figure 7

ID
ZDB-IMAGE-250701-35
Source
Figures for Cho et al., 2025
Image
Figure Caption

Figure 7

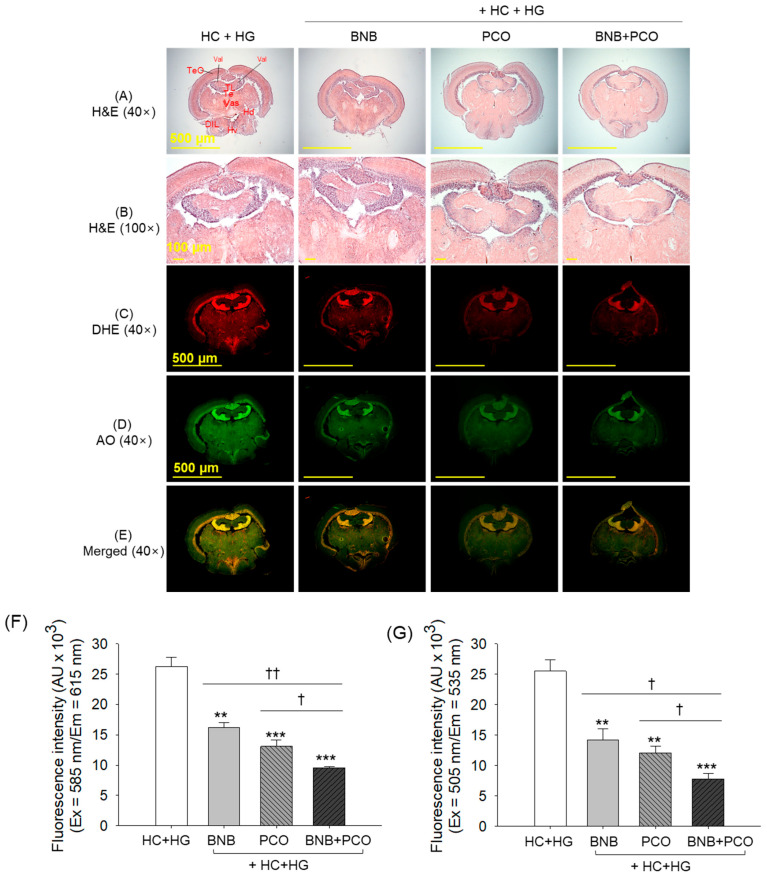
Brain histology after 6 weeks of consumption of banaba (BNB, 0.1% w/w), policosanol (PCO, 0.1% w/w), and mixture of the banaba and policosanol (BNB+PCO, each 0.1% w/w) supplemented with high cholesterol (HC, 4% w/w) and high galactose (HG, 30% w/w) diet. (A,B) Hematoxylin and eosin (H&E) staining at 40× and 100× magnification, respectively. (C) Dihydroethidium (DHE) staining. (D) Acridine orange (AO) staining and (E) merge images of DHE and AO staining. (F,G) Quantification of DHE and AO fluorescent intensities. The ** and *** underscore the significant variance at p < 0.01 and p < 0.001, vs. HC+HG group. The and †† highlight significant differences at p < 0.05 and p < 0.01, vs. BNB+PCO.

Acknowledgments
This image is the copyrighted work of the attributed author or publisher, and ZFIN has permission only to display this image to its users. Additional permissions should be obtained from the applicable author or publisher of the image. Full text @ Pharmaceuticals (Basel)