IMAGE

Figure 2

ID
ZDB-IMAGE-250701-30
Source
Figures for Cho et al., 2025
Image
Figure Caption

Figure 2

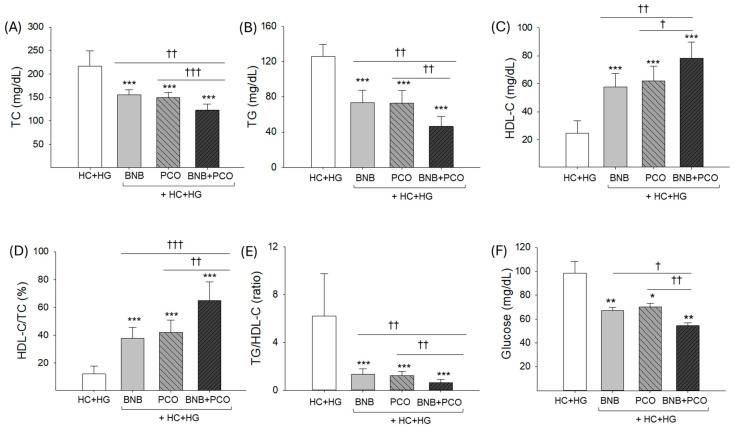
Comparison of blood lipid profile and glucose level after 6 weeks of consumption of banaba (BNB, 0.1% w/w), policosanol (PCO, 0.1% w/w), and mixture of the banaba and policosanol (BNB+PCO, each 0.1% w/w) supplemented with high cholesterol (HC, 4% w/w) and high galactose (HG, 30% w/w) diet. (A) Total cholesterol (TC), (B) triglycerides (TGs), (C) high-density lipoprotein cholesterol (HDL-C), (D) percentage ratio of HDL-C/TC, (E) ratio of TG/HDL-C, and (F) blood glucose level. The *, **, and *** underscore the statistical difference at p < 0.05, p < 0.01, and p < 0.001, respectively vs. HC+HG group. The †, ††, and ††† highlights statistical difference at p < 0.05, p < 0.01, and p < 0.001, vs. BNB+PCO.

Acknowledgments
This image is the copyrighted work of the attributed author or publisher, and ZFIN has permission only to display this image to its users. Additional permissions should be obtained from the applicable author or publisher of the image. Full text @ Pharmaceuticals (Basel)