IMAGE

Figure 4

ID
ZDB-IMAGE-250701-32
Source
Figures for Cho et al., 2025
Image
Figure Caption

Figure 4

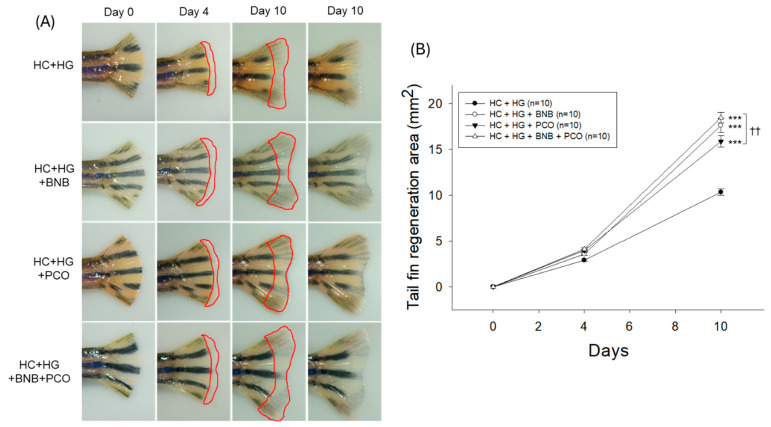
Comparison of amputated tail fin regeneration of zebrafish following consumption of banaba (BNB, 0.1% w/w), policosanol (PCO, 0.1% w/w), and mixture of the banaba and policosanol (BNB+PCO, each 0.1% w/w) supplemented with high cholesterol (HC, 4% w/w) and high galactose (HG, 30% w/w) diet. (A) Tail fin regeneration morphology during 10 days post-amputation. The regenerated tissue area is bordered by the red line. (B) Quantification of the regenerated tail fin area during 10 days post-amputation. The *** underscores the significant variance at p < 0.001 vs. group HC+HG. The †† highlights statistical difference at p < 0.01 vs. BNB+PCO.

Acknowledgments
This image is the copyrighted work of the attributed author or publisher, and ZFIN has permission only to display this image to its users. Additional permissions should be obtained from the applicable author or publisher of the image. Full text @ Pharmaceuticals (Basel)